
Drugmakers break record for most January list price increases in a decade
New Year, New Record
This January, drugmakers collectively have pushed through more brand name list price increases than any other January in the last decade. This surprising development is driven by one or more of the following factors, in our view:
They don’t care about the groundswell in public scrutiny on U.S. drug prices
They are testing their COVID-19 vaccine goodwill wave to see how far it will carry them
They have little choice in the matter, and are simply adjusting prices to offset higher rebate demands by the increasingly consolidated insurer/PBM healthcare behemoths
Swelling Medicaid enrollments and continued growth of the 340b program are pushing more of the drugmaker financial portfolio from profitable lines of business to their least profitable lines
But it’s 2021 now, which means we really should attempt to more optimistically reframe what seems like a depressing introduction. So here’s the bright side – at least we now have a mechanism to deliver these price increases to you, with context. Before we relaunched our Brand Drug Price Change Box Score, there wasn’t even a tool available in the public domain for you to comprehensively explore price increases on brand name drugs, along with historical price fluctuation trends. At least now there is.
Leveling Up
Now that our Box Score is out and about, we figured it was a good time to revisit the layout and structure of our monthly generic drug NADAC report. If you’ve been keeping track, we’ve published this report every month (come rain or shine) dating back to August 2018. While we initially developed the report to communicate the monthly impact of generic drug deflation, the report has evolved over the years into a fairly comprehensive score card on the overall impact of monthly changes in generic drug pricing. But generic drugs are a small (and shrinking) piece of the overall drug cost picture, so we figured it was time to level up this monthly report by bringing in a section or two on brand drug price changes, with focus on what we’ve learned each month from our Box Score visualization.
So without further adieu, we are thrilled to introduce you to our newly enhanced 46brooklyn Monthly Drug Pricing Report.
The CLIFF NOTES
On January 20, CMS published its latest update to the National Average Drug Acquisition Cost (NADAC) database. As a reminder, NADAC is the best national public database of surveyed pharmacy invoice costs to acquire prescription drugs. In other words, if you are looking to understand what pharmacies are paying to purchase drugs from their wholesalers each month (before rebates), and you don’t have tens of thousands of dollars buy this data, NADAC is where you must go.
As we’ve discussed at length over the years, NADAC is lagged by roughly two months. So the survey prices we just received in January reflect pharmacy invoice costs from November.
With regards to generic drugs, today’s key takeaway is our finding that this month’s NADAC price changes resulted in another $38 million in annualized generic drug deflation based on Medicaid’s drug utilization.
With regards to brand drugs, as already mentioned, drugmakers have been raising prices at a dizzying pace this month. At the time of writing (1/25/2021) drugmakers collectively increased prices on 929 drugs, setting a record for most January price increases in the past decade (previous high was 895 in 2018).
We also looked at the top 25 drugs (by gross spending) in Medicare Part D, and found that drugmakers increased the list price of 20 of them, resulting in an overall weighted average on the Top 25 of 4.3%. This translates to an extra $2.3 billion in list price inflation on the 20 drugs. And list prices in Part D are important, as beneficiaries directly pay ~25% of them below catastrophic coverage, and the Federal government (i.e. us as taxpayers) pay 80% of them after a beneficiary has crossed over into catastrophic coverage.
For those of you short on time, there’s your cliff notes summary.
For those of you interested in the details, here we go.
Brand Name Medications
1. A record January for brand drug list price increases
With well over 900 increases to brand name drug list prices (i.e. “WACs”) this month, where do we start? How about with some historical context. Figure 1 shows the number of January price increases over the last decade. Even with a few days left in the month (this data was pulled on 1/25/2021) January 2021 has already raced past all other Januaries over the past decade to claim the January drug price increase throne.
Figure 1
Source: 46brooklyn Research, derived from Elsevier Gold Standard Drug Database (GSDD)
While we are not discounting the significance of this “achievement,” especially given the interesting timing of it happening at the same time that drugmakers are in the spotlight (for both good and bad reasons), we must acknowledge that aside from the fact that there are giant rebates that drugmakers end up shaving off the list price, it is also true that counting list price increases is only one small part of the drug pricing story. Yes, the count is high, but as our Box Score visualization clearly illustrates:
The magnitude of price increases is in line with prior years (median +4.9% in 2021 vs. +5.0% in 2020; weighted average +5.1% in 2021 vs. +5.2% in 2020)
The price increases have impacted a similar percentage of Medicaid’s overall spend on brand drugs (66% in 2021 vs. 70% in 2020… although, 2020 reflects an entire year, while 2021 is only January).
So essentially, while the number of price increases is up, other measures are showing trends that are not materially out of step with prior years.
However, quite possibly the most interesting chart in our Box Score shows what Medicaid is paying (pre-rebate) for the drugs that drugmakers have chosen to increase. So far in 2021, this has exceeded $1,000 per claim, up nearly five-fold from just $216 per claim in 2011 (Figure 2).
Figure 2
Source: 46brooklyn Research, derived from Elsevier Gold Standard Drug Database (GSDD)
In other words, the pool of brand drugs that drugmakers have collectively increased this year carries a price tag that appears to be growing significantly over time. This speaks to the impact of higher launch prices, and more generally the importance of “drug mix,” a concept we described in detail earlier this month.
2. Top 25 Medicare Part D drugs see 4.3% weighted average increase in January 2021
For those of you who have tinkered around with our Box Score, you may recall that all the way towards the bottom of the dashboard (in Stat Box #8), we show you price increases on the top gross spending brand drugs in Medicaid. Thanks to the detail offered by CMS on Medicaid drug utilization – which is provided at the National Drug Code (NDC) level – we were able to build this into the dashboard to help users find price increases on some of the more heavily utilized drugs in the U.S.
As we explained in our dashboard FAQs, or many reasons (chief among these the distorting effects on relative drug utilization of the Medicaid Drug Rebate Program, or MDRP), Medicaid drug utilization, is not the ideal data set to use to rank-order drugs by spending in the U.S. But it is the only U.S. program with granular enough public data to use to add to the Box Score, so we figured it was much better than nothing.
However, data is available on other U.S. drug programs, namely, the ~$180 billion in pre-rebate spending monster we know as Medicare Part D. In December, CMS released 2019 drug-level spending for the Part D program, which we re-organized into our Part D dashboard. Figure 3 shows the top 25 drugs by pre-rebate spending in 2019, ranked from high to low. Overall, Part D spent more than $54 billion on these 25 drugs alone, which was 30% of the entire program. While CMS doesn’t provide a key (like NDC) to programmatically match drugs in its list to any other pricing database, we were able to manually match January price increases for the top 25 drugs (Figure 3).
Figure 3
Source: 46brooklyn Research, derived from Elsevier Gold Standard Drug Database (GSDD) and CMS.gov
Figure 3 shows us that the weighted average January 2021 increase on the top 25 drugs in Part D was 4.3%, down slightly from 4.5% in January 2020. While there were a few drugs on the list that increased at a slower pace than last year (e.g. Revlimid, Jardiance, Myrbetriq), the key takeaway is that January 2021 was essentially business as usual for the manufacturers of these blockbuster drugs.
Ultimately, as shown in the right-most column of Figure 3, these January 2021 price increases will add just over $2.3 billion in pre-rebate spending to Part D. And before you dismiss the significance of this number due to rebates, consider that in today’s Part D cost share, beneficiaries pay roughly 25% of a drug’s pre-rebate cost before they get to catastrophic coverage. And then after a beneficiary crosses the catastrophic “finish line,” the federal government (which means you, fellow taxpayer) picks up 80% of the pre-rebate tab. Long story short, list prices are very meaningful in Medicare Part D.
3. Insulin: Grassley/Wyden investigation and the new kid on the block
In case you missed it, and because we can’t stop reading it, Senators Chuck Grassley (R-Iowa) and Ron Wyden (D-Ore.) recently released the results of their bipartisan investigation into the skyrocketing price of insulin. We cannot applaud the Senators, their staff, and all involved enough for their work on this project. When we launched 46brooklyn in August 2018, we wrote that the drug supply system in this country was sick; this Grassley/Wyden Senate Finance Committee report is nothing less than a detailed diagnostic of the sickness. Don’t believe us? Just consider this quote from the press release:
“the drug makers [Eli Lilly and Novo Nordisk] were aware that higher list prices meant higher revenue for PBMs, and that lowering list prices could be viewed negatively by PBMs and health plans, even though it meant higher out-of-pocket costs for patients.”
We cannot help but feel the outlook for our drug supply system is bleak when we read and re-read this report. Who is working for lower prices if the drug manufacturers are saying the pharmacy benefit managers (PBMs) will punish them for lowering prices? And how much trust can remain with the PBMs who despite these harsh facts, time and again state they are “the only health care actors working to lower prescription drug prices”?
But, in keeping with our 2021 brighter outlook commitment, we would be remiss if we didn’t draw your attention to at least one bright spot within the insulin drug pricing conundrum. Back in June 2020, the FDA announced that another insulin glargine biosimilar (Semglee) had been approved. While this announcement largely went unnoticed, we were excited, as we have seen in our international pricing work that Semglee was consistently the lowest priced insulin glargine product offered. But as we know by now, the U.S. is a unique beast when it comes to drug pricing, thanks to nonsensical inflated prices churned out in large part due to the rebate/formulary game of cat and mouse played by the PBMs and drugmakers. So we had little hope that this Semglee pricing discount seen internationally would hold here in the U.S.
However, we were thrilled to learn this month that our assumptions wrong. As of this month, we now have NADAC prices for Semglee, which we can compare to the other insulin glargine products in Lantus (the originator product from Sanofi) and the first biosimilar Basaglar (from Eli Lilly). As can be seen in Figure 4 below, Semglee is 65% cheaper for pharmacies to acquire than Lantus and 54% cheaper than Basaglar:

Figure 4
Source: Data.Medicaid.gov, 46brooklyn Research
And while this is great news that should be celebrated, we do wonder if it will ultimately matter. We know from the Grassley-Wyden investigation that PBMs and their clients may forgo the savings offered by Semglee due to the rebates offered by Lantus, and even Basaglar. We also know that substitution of these products won’t be easy due to the different interchangeability standards for drugs like insulin compared to typical brands and generics; meaning that doctors and patients who want Semglee will have more barriers to jump through beyond PBM formulary restrictions. But we are hopeful for the first time in a long time on the prospects of meaningful pricing competition in the insulin market, and it is something we will be keeping an eye on in 2021.
Generic Medications
1. Unweighted price change analysis is deflationary
Each month, we look at how many generic drugs went up and down in the latest month’s survey of retail pharmacy acquisition costs, and compare that to the prior month (Figure 5).
Basically, the quick way to read Figure 5 is to look for blue bars that are taller than orange bars to the left of the dotted line, and exactly the opposite to the right of the dotted line. That would indicate a good month – more generic drugs going down in price compared to the prior month, and less drug prices going up.
Figure 5
Source: Data.Medicaid.gov, 46brooklyn Research
And that’s largely what happened this month. In January 2021, there were 9% more drugs that decreased in price by 0-10%. Meanwhile, the number of drugs that increased by 0-10% was essentially flat month-over-month.
Turning to the drugs that moved by double-digit percentages, 14% fewer drugs increased by more than 10%, only slightly offset by a 2% decline in the number of drugs that decreased by more than 10%.
Take all this with a grain of salt though, which is what most unweighted price analysis is worth in our opinion. To really make heads or tails of all of these pricing changes, let’s weight them.
4. Weighted Medicaid generic deflation comes in at $38 million
The purpose of our NADAC Change Packed Bubble Chart (Figure 6) is to apply utilization (drug mix) to each month’s NADAC price changes to better assess the impact. We use Medicaid’s 2019 drug mix from CMS to arrive at an estimate of the total dollar impact of the latest NADAC pricing update. This helps quantify what should be the real impact of those price changes from a payer’s perspective (in our case Medicaid; individual results may vary).
The green bubbles on the right of the Bubble Chart viz (screenshot below in Figure 6) are the generic drugs that experienced a price decline (i.e. got cheaper) in the latest survey, while the yellow/orange/red bubbles on the left are those drugs that experienced a price increase. The size of each bubble represents the dollar impact of the drug on state Medicaid programs, based on utilization of the drugs in the most recent trailing 12-month period (i.e. bigger bubbles represent more spending). Stated differently, we simply multiply the latest survey price changes by aggregate drug utilization in Medicaid over the past year, add up all the bubbles, and get the total inflation/deflation impact of the survey changes.

Figure 6
Source: Data.Medicaid.gov, 46brooklyn Research
Overall, in December, there was $89 million worth of inflationary drugs, offset by $128 million of deflationary generic drugs, netting out to $38 million of deflation for Medicaid.
Before we dive into some of the specific drug details, we have one more top-down analysis to run – that is to investigate how generic drug prices are trending over time.
5. Year-over-year generic oral solid deflation rises to 15.7%
Ever since last June, we have been tracking year-over-year generic deflation for all generic drugs that have a NADAC price. We once again weight all price changes using Medicaid’s drug utilization data. Beginning in August 2019, we had been seeing a gradual compression in deflation (Figure 7). But oddly enough, as the pandemic started, this trend started to reverse, only starting to return over the last few months. This month, oral solid generic deflation inched up to 15.7% year-over-year (YoY), solidly above its average over the past 24-months. Deflation on all generics also increased slightly to 11.5%.
Figure 7
Source: Data.Medicaid.gov, 46brooklyn Research
6. Stocking up on generic drug deflationary essentials
Now that we have gotten the aggregate picture out of the way, let us explore some of the more nuanced details. In this section, we provide a curated list (gallery of images below) of some of the more interesting generic drugs we see declining in price in this NADAC report and offer a brief commentary as to what we are seeing.
To start, here is the list of drugs, along with their typical use, that we are presenting in the gallery below. Note that each of these drugs experienced a price decrease, which when when sized using Medicaid’s utilization lowers annualized Medicaid expenditures by $1+ million each:
Albendazole 200 mg - to treat tapeworm infections
Mycophenolic Acid 180 mg - to prevent kidney transplant rejections
Dalfampridine ER 10 mg - to treat multiple sclerosis (MS)
Clobazam 20 mg - to treat seizures
Cinacalcet 30 mg - to treat secondary hyperparathyroidism (HPT) in patients with chronic kidney disease on dialysis


Perhaps the most interesting drug on our curated list is albendazole 200 mg. Not necessarily because of the disease it treats, but because of the recent news of a Mark Cuban-backed start-up recently starting to distribute albendazole for just $15 per tab wholesale.
Now it is important to note that the prices reflected in this NADAC update do not directly account for that product’s introduction in January (remember, the January NADAC update reflects November 2020 pharmacy purchases). It is nonetheless interesting to see this drug already begin to decline prior to this announcement. Our channel checks suggest that there is a large delta in acquisition prices for albendazole between wholesalers, principally primary or secondary, into what price this drug can be acquired at, and so perhaps this NADAC update is reflecting a larger share of albendazole being purchased from the secondary generic wholesaler market. That’s just a theory though – one that we have no way of validating. Nonetheless, it’s a safe bet that there will be further downward pressure on albendazole prices as Mark Cuban Cost Plus Drug Co’s offering seeks to gain traction in the market.
7. Keeping tabs on the generic drug increases
In keeping with our detailed view of drugs, this section provides a curated list (gallery of images below) of some of the more interesting generic drugs we see increasing in price in this NADAC report and offer a brief commentary as to what we are seeing.
The list of these drugs, along with their typical use, is below followed by the gallery:
Acetaminophen 325 mg - to treat pain and fever
Lansoprazole ODT 30 mg - to treat heart burn and stomach ulcers
Lamotrigine ER 50 mg - to treat seizures
Clonidine ER 0.1 mg - to treat blood pressure
Atomoxetine 40 mg - to treat attention deficit hyperactivity disorder (ADHD)


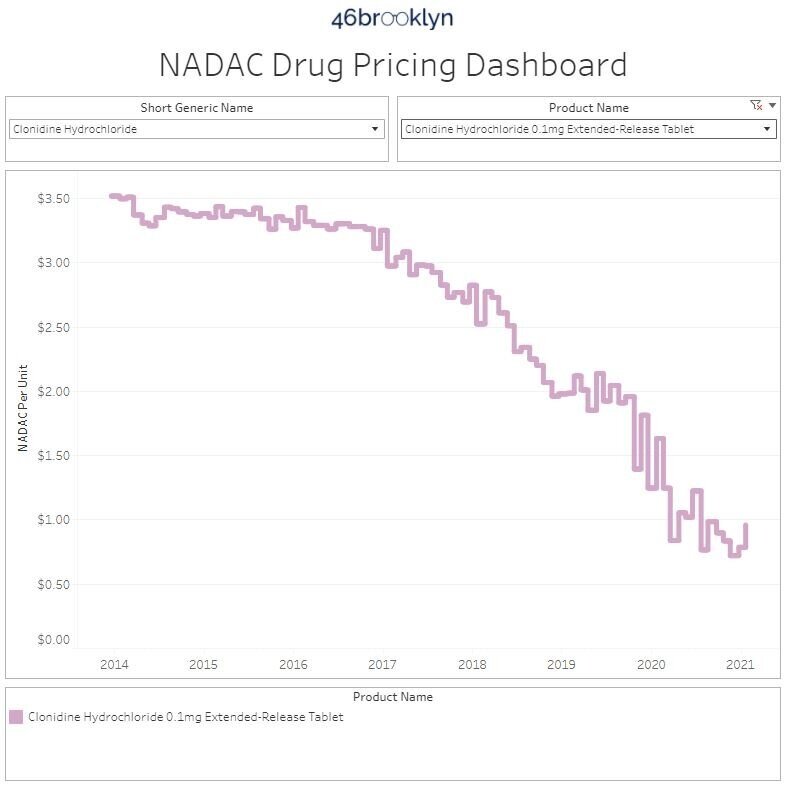
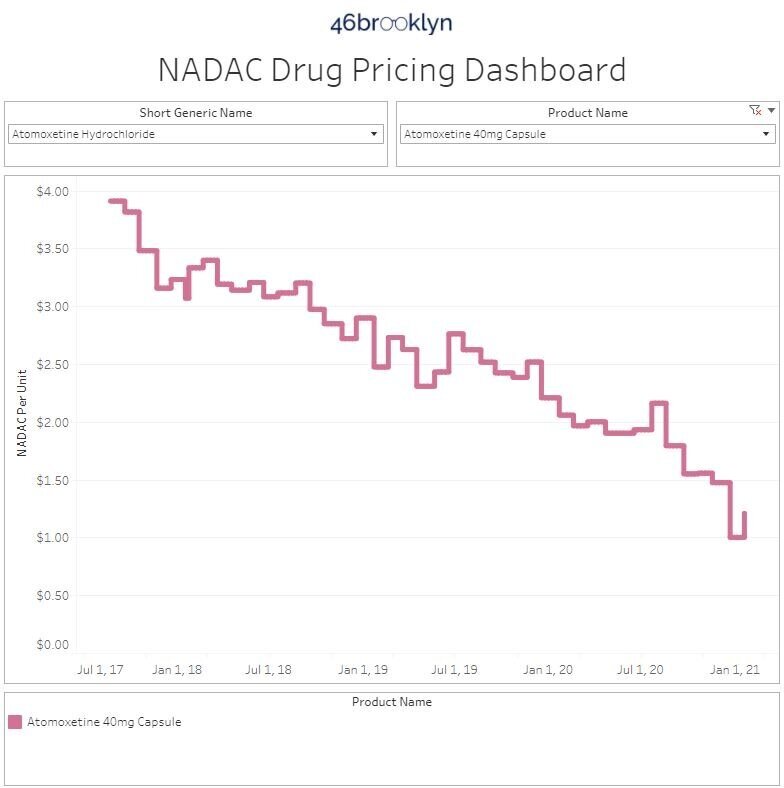
Most of these drugs we have collected have a long track record of price decreases over time. These price increases may just demonstrate some of the volatile nature of generic drug purchasing, where buying at the right time can be just as important as buying from the right source.
Acetaminophen is arguably the most interesting of these drugs as it is a very prevalent drug, as well as present in a lot of combination products (e.g. oxycodone-acetaminophen). While it did experience a 55% price increase, and is one of the few trending toward higher prices over time in our gallery, the new price per unit is just $0.03. Therefore, this price increase is likely explainable by increased demand for fever treatments during cold season, as well as the global pandemic still in full swing.
8. ADPIT highlights upward price movements on some popular (but still very cheap) generics
Finally, let’s check in on our Abnormal Drug Pricing Increase Tracker (ADPIT) and see what it has to say about this month’s data. As a reminder, ADPIT takes all of the NADAC prices for one drug over any given 52-week period, ranks them, finds the 90th percentile for the price, and then compares the current price to that 90th percentile price. If the current price is above the 90th percentile, we consider the current week’s price to be “abnormal” and add it to the list for you to peruse. Then we do this for another 20,000 or so drugs for good measure to complete the list, shown in Figure 8.
If this is the first time you are seeing this, we include the number of annual Medicaid prescriptions for each of these abnormally priced drugs, and then two metrics we created – one called Relative Impact Ratio (RIR) and another called Relative Impact Score (RIS). RIR simply tells you how far above the 90th percentile a drug’s price currently is (i.e. montelukast at 1.13 means it’s 13% above its T-52 week 90th percentile price). RIS multiplies the number of annual Medicaid prescriptions by (RIR - 1) to size the impact of the “pricing abnormality” (for montelukast, 13% x 4,884,563 prescriptions = 789,200). Add up all the RIS for all of the drugs each week, take the four-week moving average, and you get the chart in bottom right of Figure 8 (which sizes the aggregate weighted impact each week). We then divide the bottom right chart into drugs with active ingredients in ongoing COVID-19 clinical trials, and all other drugs. Check out our interactive ADPIT tool here, and find more information on how to use it here and here.
Figure 8
Source: Data.Medicaid.gov, ClinicalTrials.gov, 46brooklyn Research
Overall, the dashboard continues to paint a relatively healthy picture for the generic marketplace, although aggregate RIS (i.e. the lower right box) continues to trend up. The good news is the largest driver of the rise in the aggregate RIS is the price spike on montelukast, which has reversed a bit this month. As such, barring any other price spikes in high utilization Medicaid drugs, we would expect the aggregate RIS to start to come back down in the coming months.
Shout-out to the National Conference of State Legislatures (NCSL) for inviting 46brooklyn’s Antonio Ciaccia to speak on their PBM panel discussion for state elected officials and their staffs this week.
Thanks to Darrel Rowland at the Columbus Dispatch for his continued leading coverage on prescription drug supply chain dynamics by being the first reporter to catch the moment that the number of January brand list price increases exceeded the decade’s previous high point.
Additional thanks to Brian Thomas at 55KRC Cincinnati for chatting with Antonio this week about rising drug prices, PBMs, and the current pharmacy benefit reforms in the Ohio Medicaid program.
Finally, we’d like to thank Chelsea Sick at WKEF/WRGT Dayton 24/7 Now for covering our new Box Score dashboard and some of the trends we’re seeing with brand list price increases. Added bonus points for visiting our offices in downtown Dayton and broadcasting right from outside our headquarters in the bitter Ohio cold.