Cheers to the triumphant return of generic drug price deflation
The CLIFF NOTES
It didn’t take long for generic drugs to once again flex their deflationary muscles. After last month’s modest (weighted average) $30 million in annualized inflation, generic drugs experienced an impressive $130 million in annualized deflation in June – the largest monthly deflation print since the $240+ million blowout back in September 2020.
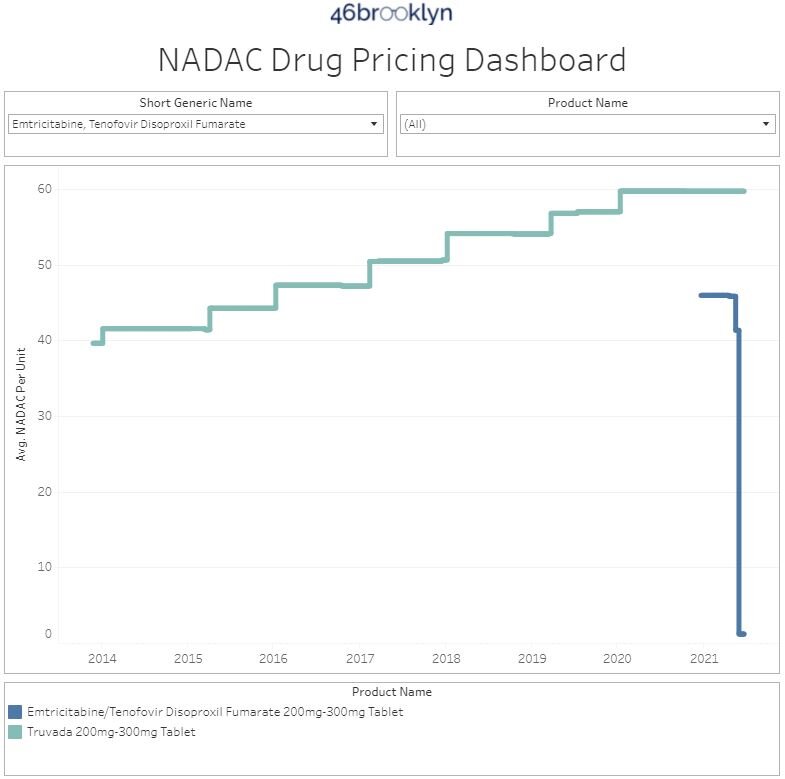
Even more impressive is that this $130 million estimate doesn’t even include the deflationary savings resulting from the collapse in the price of generic Truvada. In early June, CMS released the first publicly-available “multi-source generic” pharmacy acquisition cost (i.e., NADAC) for generic Truvada of $1.18 per tablet. That’s a 97% discount to brand-name Truvada’s $58.14 per tablet pre-rebate price paid by Medicaid in 2020. Considering that Medicaid collectively purchased 5,619,888 Truvada tablets in 2020, this $56.96 savings per tablet adds up quickly – to the tune of over $300 million in annual savings.
Let’s be real though… if you’ve been even casually reading our work over the past few years, you already know that no one pays pre-rebate prices except the uninsured, patients in high deductible health care plans plans, and small employers. Medicaid certainly doesn’t pay nosebleed list prices for brand drugs. Instead, Medicaid programs shell out $58.14 for each brand-name Truvada tablet, and then get some large undisclosed rebate back from Gilead in return. So it’s not accurate to quantify the savings to Medicaid of switching to generic Truvada by comparing the generic’s latest cost to the brand’s list price. But it is fair to alert state Medicaid programs and other plan sponsors that, going forward, if you are going to choose to dispense brand-name Truvada over its generic equivalent, you better be getting a rebate on the brand that’s north of 97% of its list price. If you aren’t, you’re flushing your precious Imperial credits down the vacc tube.
On the brand drug side, it was another slow month in terms of list price increases. There were a total of 12 medications taking increases, an all-time low for the month of June over the last decade. To put that into perspective a little bit, the highest number of price increases in the month of June was 233 in June 2016 when mid-year brand price increases were a more common phenomenon.
As we noted in our last report, this year has broken a lot of trends in terms of brand-name list price increases, with the 2021 total already eclipsing the number of price increases taken in all of last year. And even though data suggests that post-rebate brand drug prices are actually going down, in an effort to keep a better eye on list price increases at the midpoint of the year, we’ll be returning to our daily tracking (excluding weekends) of brand name price increases for the first week of July.
For more details on the specific brand drugs that moved in June, along with our standard recap on changes to surveyed generic drug acquisition costs, read on.
Brand Name Medications
1. A historically light June for brand drug list price increases
There were a total of 12 brand-name medications that saw wholesale acquisition cost (WAC) price increases in June, which are all featured and contextualized in our Brand Drug List Price Change Box Score.
Price increases this month ranged from 2.5% to 7% and impacted $400 million in prior year gross Medicaid expenditures (a much higher number then last month’s $30 million). As a reminder, brand price increases in Medicaid are largely held in check thanks to the Medicaid Drug Rebate Program (MDRP), which includes rebate penalties for drug price increases. For everyone else, results will vary.
2. Brand drug price changes worth taking note of in May
Because of the small number of price increases this month, we can quickly review each of them below:
June 1st price increases
Plaquenil (hydroxychloroquine) took a 5.6% price increase. Our readers will almost certainly recall when hydroxychloroquine products were, at one point over the last year, all the rage – with state governments stockpiling millions of doses of the stuff and doctors panic-prescribing it for their dogs and arthritic goldfish. We could only speculate as to why this price increase is occurring now, but it could have something to do with recent shortages, which were flagged by the American Society of Health-System Pharmacists on June 4. During drug shortages, it’s not unusual to see price spikes, and for our long-time readers, hydroxychloroquine shortages and price spikes will likely elicit déjà vu. It is worth noting that Plaquenil is a brand with generic competition and consequently almost no money is spent within Medicaid on the brand name product.
Leukine (sargramostim) helps the body make white blood cells after chemotherapy or a transplant. It has also been studied in regards to COVID-19 infections, where it was associated with lung improvement in hospitalized patients. While we can’t be sure, perhaps that spurred the 5% list price increase this drug took in June.
Drizalma (duloxetine) is an antidepressant that is a reformulation of an existing, already generic product (Cymbalta). This product saw a 7% list price increase, which impacts approximately $200,000 in prior year gross Medicaid spending.
Ezallor (rosuvastatin) is a medication used to help lower cholesterol that is a reformulation of an existing, already generic product (Crestor). This product saw a 7% price increase, but doesn’t have much utilization in Medicaid.
Kapsprago (metoprolol) is a medication that lowers a person’s heart rate that is a reformulation of an existing, already generic product (Toprol XL). This product saw a 7% price increase, which impacts approximately $120,000 in prior year gross Medicaid spending.
Note that all three of the prior listed, re-formulated products (Drizalma, Ezallor, Kapsprago) are all made by the same manufacturer, Sun Pharmaceuticals.
ProAir HFA & RespiClick (albuterol) is an inhaled medication used in the treatment of asthma, COPD, and other respiratory conditions. Both formulations of this product saw a 5.9% price increase, which impacts approximately $290 million in prior year gross Medicaid spending. However, it is important to note that there are now generic versions of ProAir HFA, and the impact of these price increases will likely be offset by utilization shifting to the generics over this year.
June 10th price increase
Vibativ (telavancin) is a medication used to treat serious infections. This product saw a 2.5% list price increase but doesn’t have much utilization in Medicaid over the prior year.
June 24th price increases
Envarsus XR (tacrolimus) is an immunosuppressant most often used in organ transplants. This product saw a 2.5% price increase that impacts approximately $13 million in prior year gross Medicaid spend.
June 29th price increase
Tavalisse (fostamatinib) is used to treat people with chronic immune thrombocytopenia (ITP). It took a 5% list price hike that increase impacts approximately $4.5 million in gross annual Medicaid spend based upon the prior year.
June 30th price increases
Mycapssa (octreotide) is a reformulation of an existing, generic injectable product into a capsule indicated for long-term maintenance treatment in acromegaly. This product saw a 4.5% list price increase but doesn’t have much utilization in Medicaid based upon last year’s data.
Adcetris (brentuximab vedotin) is used to treat certain kinds of blood cancers. This product saw a 3.9% list price increase that increase impacts approximately $79 million in gross annual Medicaid spend based upon the prior year.
3. So what’s happening with brand drug price increases?
While a headline takeaway is certainly the break in a downward trend in the number of brand drug price increases (prior to this year, the number of annual list price increases has been declining steadily since 2016), it’s worth remembering that we have already eclipsed the total number of price increases in all of last year, and we do not yet know whether we will see a return of mid-year price increases (where a drug that already took a price increase at the start of the year takes another price increases). And while it’s true that many of these brand drugs have generic alternatives, and it’s also true that in the aggregate, net prices on all brand drugs have been declining, list prices ultimately are a very relevant data point in unravelling the mystery of prescription drug costs.
As previously stated, our goal is to monitor price increases at the start of the month of July to see if there are any mid-year price increase takers.
Generic Medications
4. A wildly favorable unweighted price change picture
Each month, we look at how many generic drugs went up and down in the latest month’s survey of retail pharmacy acquisition costs (based on National Average Drug Acquisition Cost, NADAC), and compare that to the prior month (Figure 1).
Basically, the quick way to read Figure 1 is to look for blue bars that are taller than orange bars to the left of the dotted line, and exactly the opposite to the right of the dotted line. That would indicate a good month – more generic drugs going down in price compared to the prior month, and less drug prices going up.
Figure 1
Source: Data.Medicaid.gov, 46brooklyn Research
That’s exactly what happened this month (in spades!). For every drug that increased in price this month, 1.39 decreased in price. That’s a stark contrast from last month, where that same ratio was just 0.83. The story gets even better when drilling into the double-digit price moves – this month, there were 57% more drugs that decreased in price (vs. last month) by 10% or more, and 36% fewer drugs that increased in price (again, vs. last month) by 10% or more.
But as usual, take this unweighted price change analysis with a grain of salt. To really make heads or tails of all of these pricing changes, let’s weight these changes.
5. Weighted Medicaid generic deflation comes in at an impressive $130 million…
The purpose of our NADAC Change Packed Bubble Chart (Figure 2) is to apply utilization (drug mix) to each month’s NADAC price changes to better assess the impact. We use Medicaid’s 2020 drug mix from CMS to arrive at an estimate of the total dollar impact of the latest NADAC pricing update. This helps quantify what should be the real affect of those price changes from a payer’s perspective (in our case Medicaid; individual results will vary).
The green bubbles on the right of the Bubble Chart viz (screenshot below in Figure 2) are the generic drugs that experienced a price decline (i.e. got cheaper) in the latest survey, while the yellow/orange/red bubbles on the left are those drugs that experienced a price increase. The size of each bubble represents the dollar impact of the drug on state Medicaid programs, based on utilization of the drugs in the most recent trailing 12-month period (i.e. bigger bubbles represent more spending). Stated differently, we simply multiply the latest survey price changes by aggregate drug utilization in Medicaid over the past full year, add up all the bubbles, and get the total inflation/deflation impact of the survey changes.
Figure 2
Source: Data.Medicaid.gov, 46brooklyn Research
Overall, in June, there was $64 million worth of inflationary drugs, offset by $194 million of deflationary generic drugs, netting out to $130 million of deflation for Medicaid, dwarfing last month’s $30 million in inflation.
6. … and that doesn’t even include $318.4 million in list price savings on Truvada!
For one reason that will soon become apparent (hint: it’s in the title of this section), it’s worth reminding our readers of a few limitations of the analysis performed in this section.
First, the above chart only aims to quantify the value of the changes in NADAC survey prices, which as a reminder, are reported once a month, and are based on pharmacy invoice acquisition costs. In June, the survey results (which as another reminder, are lagged by roughly two months) were released on June 23. We simply take the price changes reported by CMS in this file and weight them using Medicaid’s mix. Now, Myers Stauffer, LC, the firm responsible for maintaining and reporting NADAC, updates prices intramonth as well. These non-survey intramonth pricing updates are largely triggered by calls into their help desk to report price discrepancies or changes in list prices (i.e. WAC) by brand drug manufacturers. So while the overwhelming majority of price changes happen during “survey week,” it is possible that prices are changing more frequently than this and therefore slipping around our monthly report’s watchful eye.
The second limitation is that we are not measuring deflation across substitutable drugs. And by that, we are specifically referring to the deflation that occurs when a brand goes off patent as a multi-source generic and its price plummets. The brand and generic versions are technically different “drugs” from NADAC’s perspective, and so are measured as different drugs in this analysis. But this isn’t how a payer would look at this situation. Instead, a payer should very much want to measure the deflation that arises from generic competition.
Now to the reveal on why we chose this report to remind you of these limitations. As we recently wrote, Truvada recently went multi-source generic, triggering a free-fall in its acquisition cost. When we published this report (May 25, 2021), NADAC hadn’t captured the fall in generic Truvada’s cost (remember, it’s lagged by two months). But that all changed on the June 2nd intra-month NADAC update in which the NADAC of generic Truvada plummeted 97%, from $41.31 per unit to $1.18 per unit. Myers Stauffer flagged this update as a “help desk” change, meaning it eluded our monthly measurement of survey-based price changes. Note that this is wonderful that Myers Stauffer didn’t wait for the end-of-month survey to report the reduced price of this drug, as many state Medicaid programs and some commercial payers are paying for drugs based on NADAC in real-time. So Myers Stauffer’s price change on June 2nd reduced the ingredient cost of generic Truvada for NADAC-based payers by 97%, three weeks earlier than we expected (i.e., price meet cliff as shown in Figure 3).
Figure 3
Source: Data.Medicaid.gov, 46brooklyn Research
But even if Myers Stauffer had waited to report this change, you wouldn’t see the full impact of its value in our packed bubble chart since the generic just came to market. Instead, to calculate the full value of this deflation, you would need to apply the new generic price ($1.18 per unit) to Medicaid’s overall utilization of brand-name Truvada in 2020 (5,619,888 units) to get Medicaid’s total “pro-forma” spend if it switched 100% of its Truvada usage to the generic going forward. Multiply those two numbers and you’ll get $6.6 million in annual spend on generic Truvada. Then you would compare that to what Medicaid actually spent in 2020 on Truvada, which was $326,762,958, pre-rebate. That’s worth repeating. Before rebates, Medicaid spent THREE HUNDRED TWENTY-SIX MILLION, SEVEN HUNDRED AND SIXTY-TWO THOUSAND, NINE HUNDRED AND FIFTY-EIGHT dollars on Truvada in 2020.
Going forward, the ingredient cost of the same number of pills comes down to less than seven million. Even if we added a $10 pharmacy dispensing fee on top of this new ingredient cost, it only brings up the all-in cost of the generic to $8.4 million, a 97% savings off what Medicaid paid in 2020. And if you read our generic Truvada report, you already know that $1.18 per unit may still be too high a price for generic Truvada, so the cost of this drug to NADAC-based payers is only going to come down from here, as NADAC catches up to the wholesale market over time.
But remember; Medicaid didn’t really pay $326 million for Truvada. Rather they paid $326 million, and then got some undisclosed large chunk of that back from Gilead. We assume (but don’t know) that the rebate Medicaid got on Truvada was (and is) sizable. All we can say is that going forward, unless this rebate is greater than 97%, states and all other payers who care purely about net drug costs should be moving from the brand to the generic. Although, we should be more specific here… states and all other payers should be moving to the generic if they are in a NADAC-based payment model or other acquisition cost-based model for generic drugs. If they are still in an AWP-based / PBM MAC-rate model, they can throw out all of this analysis and cross their fingers that their PBM will altruistically choose to hand over these full deflationary savings.
7. Year-over-year generic oral solid deflation jumps back up to 20%
Ever since last June, we have been tracking year-over-year generic deflation for all generic drugs that have a NADAC price. We once again weight all price changes using Medicaid’s drug utilization data. Beginning in August 2019, we had been seeing a gradual compression in deflation (Figure 3). But oddly enough, looking back, the start of the pandemic turns out to have been the low point for generic deflation, with the deflationary trend rapidly moving upward ever since. This month, deflation on both oral solid generics and all generics spiked back up to 20% and 15%, respectively.
Figure 3
Source: Data.Medicaid.gov, 46brooklyn Research
8. Top/notable generic drug decreases this month
In addition to the aforementioned generic Truvada, several other notable generic medications saw sizable decreases in their NADAC prices. The noteworthy ones in our mind are as follows:
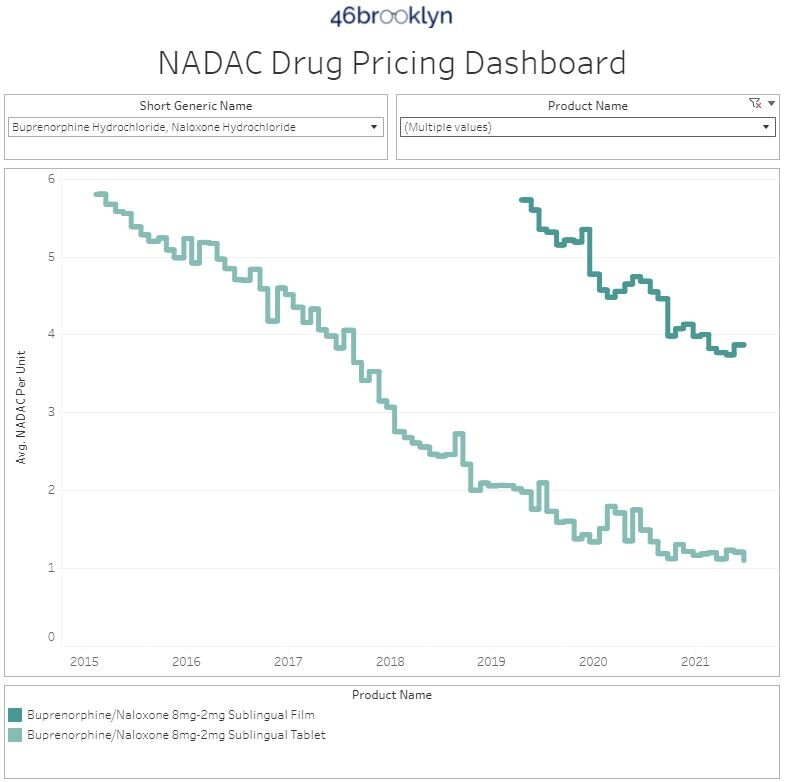
buprenorphine / naloxone tablets (generic for Suboxone) – a medication used to treat opioid use disorder. For the sake of comparison, we include the alternative film dosage form of buprenorphine/ naloxone, which saw a slight increase in price and is four times the cost of the tablets, because it shows that even in the generic market, dosage form can have a big impact on price.
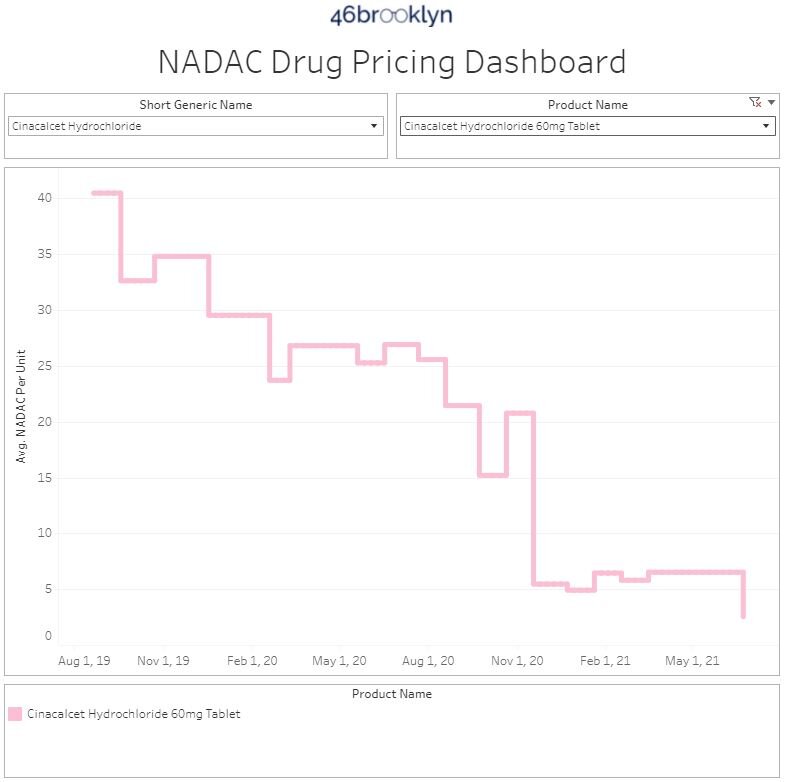
cinacalcet (generic for Sensipar) – a medication used in people with kidney disorders to lower calcium
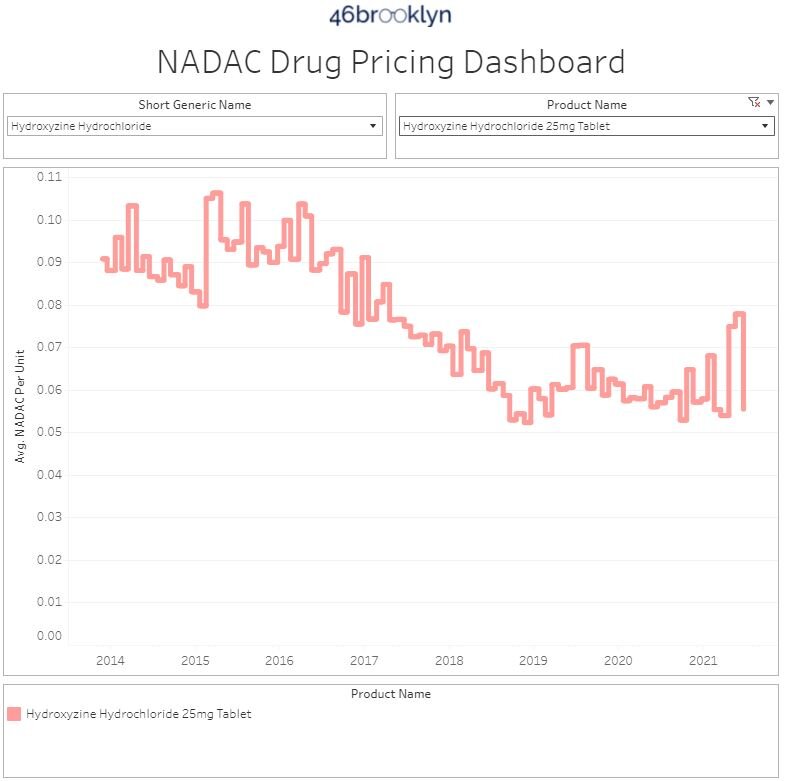
hydroxyzine HCL – a medication which can be used for a number of conditions including anxiety and itching
8. Top/notable generic drug increases
While there were not many impactful generic price increases, we highlight the following of interest.
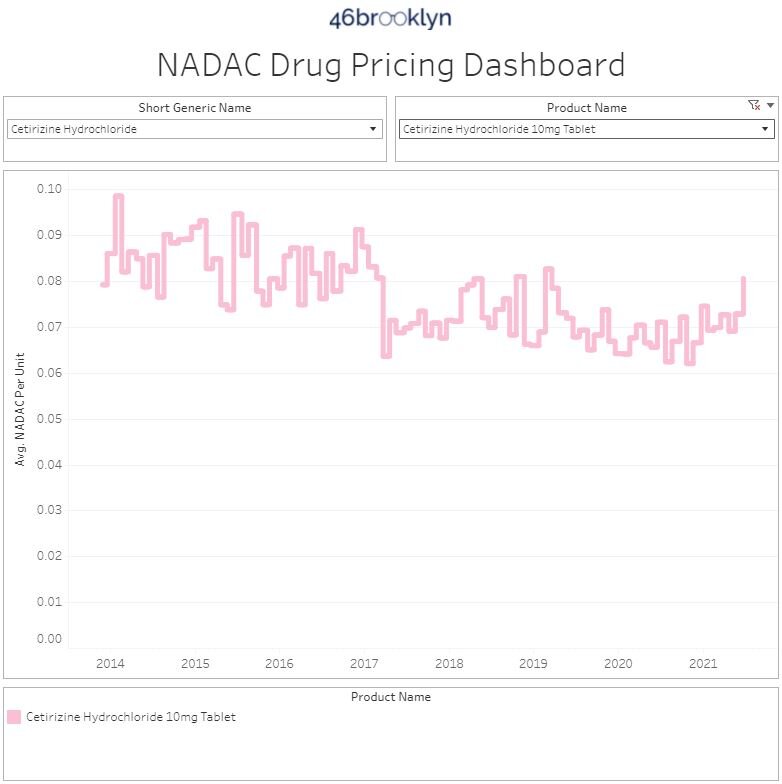
cetirizine (generic for Zyrtec) – a medication to treat allergies and always seems to take a slight price increase during allergy season
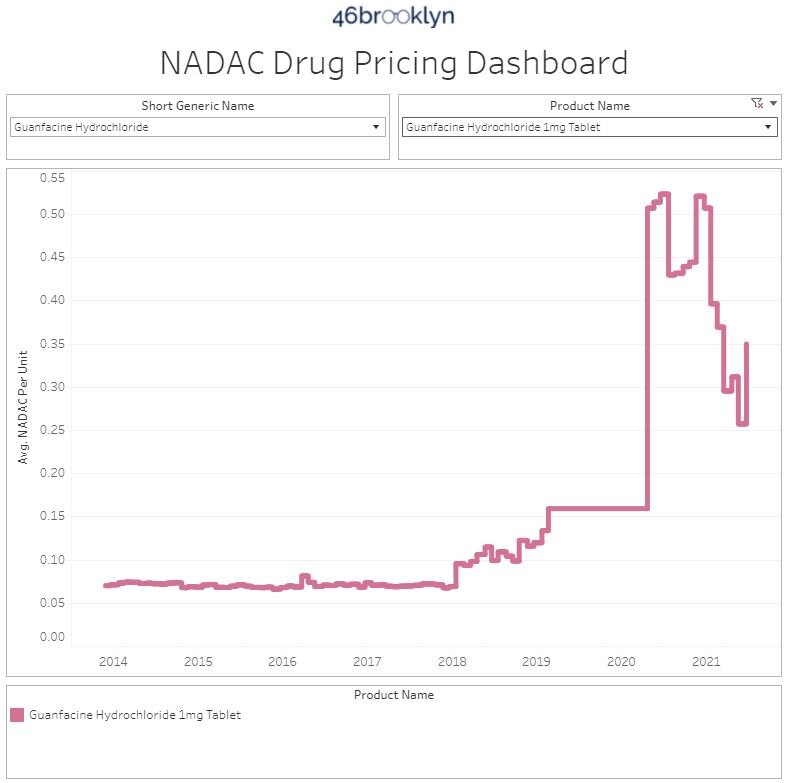
guanfacine (generic for Tenex) – a medication used in managing blood pressure
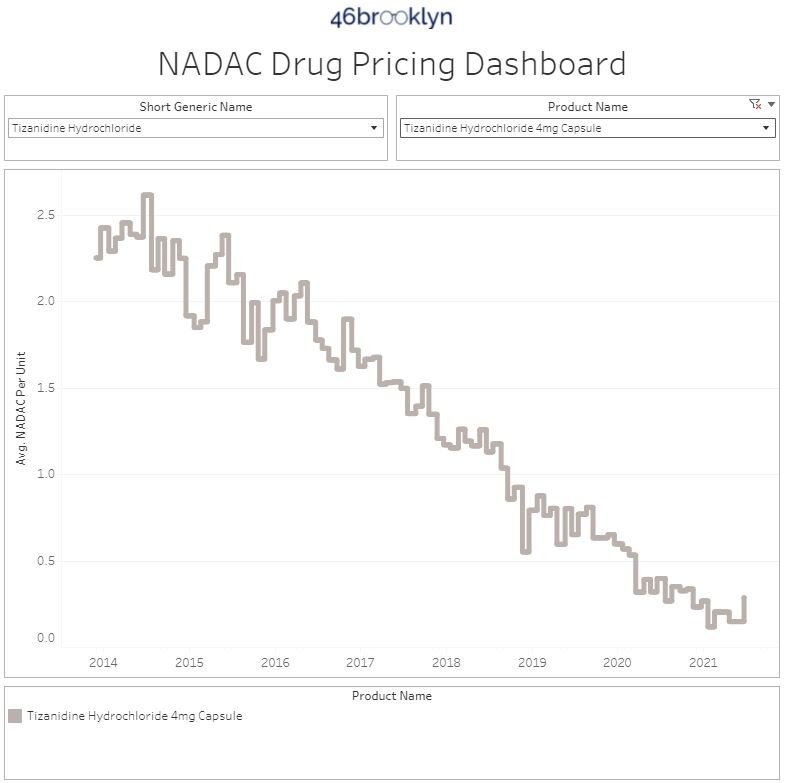
tizanidine capsules (generic Zanaflex) – a medication used to treat muscle spasms
Note that with all these generic price increases, the overall trend for these medications has been largely deflationary, and unless they keep this trend going, these are more likely than not to be one-time blips on the generic deflationary pricing journey.
To that end, we are ending our monthly report here. Long-time readers will note that means that we’re no longer talking about our Abnormal Drug Price Increase Tracker (ADPIT) visualization. And while we love that visualization (and it’ll keep getting updated), it just doesn’t seem to be part of the drug pricing story for the time being. When we made ADPIT, we were concerned about price increases at the start of COVID and wanted a way to track whether price increases would be sustained. It turns out, those price increases didn’t materialize. In fact, as we’ve just written about, we are seeing sustained generic drug deflation, which means we don’t need to include ADPIT in this report and will only go back to it when it shows us something worth writing about. It’s worth noting that the manufacturer and wholesaler segments of the generic drug supply chain were incredibly resilient and generally non-exploitative in the face of incredible challenges and robust opportunity for unprecedented arbitrage. While few in the public will recognize this achievement, the nerds at 46brooklyn tip our caps to you. Rest assured though that we’ll continue to monitor ADPIT each month and if it flags anything worth sharing with you, you’ll see it right here.
Thanks to Shelby Livingston at Business Insider for her excellent reporting on the billion dollar drug pricing news from last month, where Centene announced major settlements with state attorneys general (led by our home state Ohio AG Dave Yost) over alleged overcharges of state Medicaid programs through multi-layered spread pricing schemes. As they say, as goes Ohio, so goes the nation.


