
As CMS drug pricing data remains missing, 46brooklyn finds solace in deflating generic drug costs
The CLIFF NOTES
Welcome back to our monthly update on drug pricing changes within the United States. If you’re perhaps new to the work of 46brooklyn Research, having maybe just found us through our foray into the world of podcasts, these monthly pricing overviews represent one of our many attempts to contextualize drug prices in the U.S.
Nevertheless, we need to acknowledge that everything we talk about here may actually not amount to anything material, at least not as measured by understanding our drug prices at the pharmacy counter. This is because this monthly update discusses the drug pricing benchmarks of WAC and NADAC, which may or may not be representative of your or our price for the same drug at the pharmacy counter. You see; drug pricing in the U.S. does not function as other forms of commodities. What do we mean? Traditionally, transparency in pricing of other commodities helps the market determine what price is, which we don’t get in the U.S. when it comes to the purchase of pharmaceuticals. Rather, the drug supply chain cannot agree on which of our myriad of pricing points actually matters, and as a result, that same drug supply chain arbitrages the pricing to generate profits, regardless of the learnings that we may glean from the benchmarks of WAC, NADAC, or any other that we discuss in this monthly update or any other drug pricing research you may find. Despite this subjectivity in what drug prices actually are, some information is better than no information, and so we press on providing what context we can with what data is available.
As it relates to data availability, we at 46brookyn remain helplessly impatient with the delays from the good folks at the Centers for Medicare & Medicaid Services (CMS), as it still has been almost a year since the Medicaid State Drug Utilization Data (SDUD) has been refreshed by CMS (the most recent data remains from Q1 2021) . The SDUD is one of the best publicly available drug pricing datasets in the country, and it enabled key research and reports into “spread pricing” just a few years ago that has led to a national reckoning on opaque mark-ups in the drug supply chain. Despite that reckoning, those publicly available insights into how drugs are priced in Medicaid programs are still very much needed today, as pricing gymnastics have continued to evolve despite the hot regulatory sunlight that has threatened to compress the revenue harvested by drug channel arbitrageurs.
We used to eagerly await the passing of each quarter, as new Medicaid data refueled a number of our ongoing drug spending analyses, such as the annual generic drug deflation or annualized prior year gross Medicaid expenditures (PYGME). Those models are now relying upon just one quarter of data multiplied 4x to get an annual figure (i.e., it’s not as good as it use to be, having to use less data points).
It is a serious drag that our monthly drug pricing report ritual now includes an email to CMS asking for an update on what is going on with the data, but alas, much like our continued requests to Jon Favreau to feature 46brooklyn team members as guest stars in a drug pricing-centric episode of season 3 of The Mandalorian, our inquiries have not been successful in yielding a response.
We continue to hope to see an update to these databases soon, as they are critical to improving our understanding of what is actually going on with drug prices in the U.S. In other words, “Help me Chiquita Brooks-LaSure; you’re my only hope.”
With that, let’s dive into our monthly update.
February saw 34 net brand drug price increases (37 raises, 3 declines) and continued generic drug deflation. The most notable brand price increases were Acthar Gel (corticotropin injection), which saw a 4% price increase and impacts $118 million in prior year gross Medicaid drug expenditures (PYGME); Nuwiq (coagulation factor VIII), which saw a 3.8% price increase impacting $40 million in PYGME; Wilate (von Willebrand factor & coagulation factor VIII complex), which saw a 4.6% increase impacting $14 million in PYGME; and Perseris (risperidone injection), which saw a 5% increase impacting $12 million in PYGME. Bear in mind that this is the price before drugmaker rebates and discounts, which, based on our own channel checks and according to some of the latest data crunched over at Drug Channels, as we know are growing significantly over time and are at their largest amounts in the Medicaid programs.
On the generic side of the coin, year-over-year (YoY) generic oral solid price deflation increased to 15.3%. And while we still see some drugs creeping up in price, none would suggest broad supply chain issues related to drug prices at this point (though we are relying upon lagging indicators).
Read on to unpack more of what we see in regards to U.S. drug price changes from February 2022.
Brand Name Medications
1. A small number of list price increases for brand drugs in February
There were a total of 37 brand-name medications that saw wholesale acquisition cost (WAC) price increases in February and three that took a price decrease, which are all featured and contextualized in our Brand Drug List Price Change Box Score.
Price changes this month ranged from -80.9% to 9.9% and impacted approximately $272 million in PYGME. As a reminder, brand price increases in Medicaid have historically been held in check thanks to the Medicaid Drug Rebate Program (MDRP), which includes rebate penalties for drug price increases that occur faster than the rate of inflation. Of course, this year has seen historic consumer price inflation. What this means for Medicaid is still playing out, but may mean that for the first time in decades, drug price increases by manufacturers will translate into higher prices in Medicaid as a result of high inflation. The typical CPI-U penalty, which has helped off-set price increases impact to Medicaid, will not trigger on these price increases when the math is run.
2. Brand price trends over time in the month of February
To help contextualize brand name drug list price increase behavior, we find it beneficial to review past trends. In comparison to prior years, this February saw a little bit more brand price increases in the net than past Februarys (Figure 1). For example, there were more net price increases in February of 2022 than there were in February 2021 (and 2021 was itself an anomaly in terms of pricing trends, because it saw so many brand price changes).

Figure 1
Source: Elsevier Gold Standard Drug Database, 46brooklyn Research
3. Brand drug list price changes worth taking note of in February
We identify drugs worth taking note of in a couple different ways. Primarily, we look for medications with a lot of prior gross Medicaid expenditures. We next look for drugs with large pricing changes (+/- approximately 10%). And finally, we look for drugs that are interesting for us either because we’ve previously written on them or because we find them of unique clinical value. This month, when looking for these drugs in the brand arena, we see a few worth mentioning:
Acthar Gel (corticotropin injection) is an analog (copy) of naturally sourced mixture of adrenocorticoropic hormones and other pituitary peptides. This is a fancy way of saying it is a drug that stimulates our adrenal cortex to secrete a variety of substances, most recognizably our bodies’ own steroids. It is indicated to treat a variety of conditions, perhaps unsurprising when you understand this hormone signal is pretty early on in a lot of body processes. Arguably the most common ways Acthar gel is used is in treating infantile spasms and multiple sclerosis. This product saw a 4% price increase and impacts $118 million in prior year gross Medicaid drug expenditures (PYGME). If the name perhaps sounds familiar to you, but you can’t quite place it, H.P. Acthar (as it was previously known) has been previously covered in drug pricing dysfunction conversations, including investigations by the House Oversight Committee. Perhaps this suggests that regulatory scrutiny of manufacturer prices alone is insufficient to change a drug’s pricing behavior.
Nuwiq (coagulation factor VIII) is a recombinant antihemophilic factor used in people (adults and children) with Hemophilia A. This product saw a 3.8% price increase, impacting $40 million in PYGME.
Wilate (von Willebrand factor & coagulation factor VIII complex) is also a blood factor replacement product, but it’s used in treating Willebrand disease (VWD). This product saw a 4.6% increase, impacting $14 million in PYGME.
Perseris (risperidone injection) is a long-acting injectable version of a product that is available in tablet form as a generic. It is used to treat schizophrenia, which can struggle with treatment compliance – hence the potential benefit of a long-acting injectable. The medication saw a 5% increase, impacting $12 million in PYGME.
Lopid (gemfibrozil) is a brand medication with a generic alternative used to lower triglyceride levels. The medication saw a 80.9% decrease impacting $0 in PYGME. As a brand with generic versions available, most people will not see a benefit of this price decrease (hence the $0 PYGME), but the drug taking such a price decrease is certainly notable.
4. Brand drug list price reminders / boiler plate
Keep in mind that all the activity on brand prices we do here is predicated off of WAC. WAC is a list price which doesn’t track typical discounts to drug costs, consistent with its definition in federal regulations. We know that brand drugs generate money from sick people (i.e., rebates) and that at times, those price concessions can be up to 80% off the WAC price (looking at you insulin). Nevertheless, despite the known shortcomings with WAC as a pricing benchmark, it is still helpful for us to track and monitor its changes because for people in high-deductible health plans (or those otherwise exposed to drug list prices), the trending of WAC can be very meaningful. We have previously explored exactly how money from sick people works a number of times. We cannot forget those learnings by simply dismissing WAC as a “fake” drug pricing benchmark, because we know it gets discounted.
Generic Medications
5. Generic unweighted price changes
Each month, after exploring brand list prices, we look at how many generic drugs went up and down in the latest month’s survey of retail pharmacy acquisition costs (based on National Average Drug Acquisition Cost, NADAC), and compare that to the prior month (Figure 2).
Basically, the quick way to read Figure 2 is to look for blue bars that are taller than orange bars to the left of the dotted line, and exactly the opposite to the right of the dotted line. That would indicate a good month – more generic drugs going down in price compared to the prior month, and less drug prices going up.
Figure 2
Source: Data.Medicaid.gov, 46brooklyn Research
That’s exactly what we saw happened in February 2022. Which, when we consider some of the broader narratives on consumer cost inflation out there, drug pricing once again shows us its resiliency, as generic drugs – the most utilized therapies out there – are getting cheaper month-over-month in most circumstances.
But as usual, take this unweighted price change analysis with a grain of salt. To really make heads or tails of all of these pricing changes, let’s weight these changes.
5. Weighted Medicaid generic deflation a modest $16.6 million in February
The purpose of our NADAC Change Packed Bubble Chart (Figure 3) is to apply utilization (drug mix) to each month’s NADAC price changes to better assess the impact. We use Medicaid’s 2020 drug mix from CMS to arrive at an estimate of the total dollar impact of the latest NADAC pricing update because of our ongoing issues with getting updated Medicaid data (see mini-rant earlier). This helps quantify what should be the real effect of those price changes from a payer’s perspective (in our case Medicaid; individual results will vary).
The green bubbles on the right of the Bubble Chart viz (screenshot below in Figure 3) are the generic drugs that experienced a price decline (i.e. got cheaper) in the latest survey, while the yellow/orange/red bubbles on the left are those drugs that experienced a price increase. The size of each bubble represents the dollar impact of the drug on state Medicaid programs, based on utilization of the drugs in the most recent trailing 12-month period (i.e. bigger bubbles represent more spending). Stated differently, we simply multiply the latest survey price changes by aggregate drug utilization in Medicaid over the past full year, add up all the bubbles, and get the total inflation/deflation impact of the survey changes.
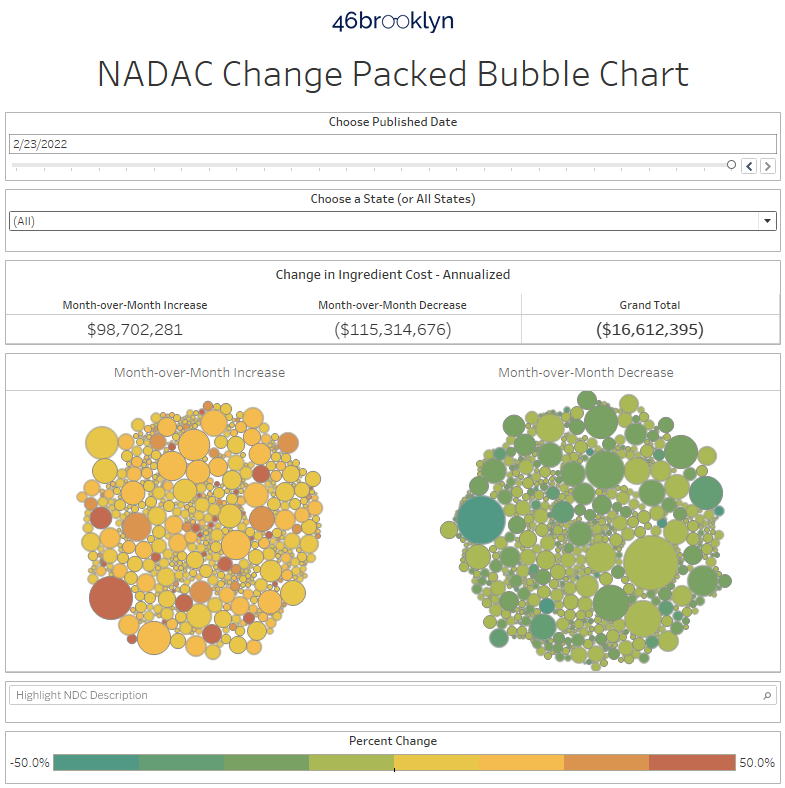
Figure 3
Source: Data.Medicaid.gov, 46brooklyn Research
Overall, in February, there was just over $98 million worth of inflationary drugs, offset by $115 million of deflationary generic drugs, netting out to $16.6 million of deflation for Medicaid.
6. Year-over-year generic oral solid deflation at 15.3%
Ever since June 2020, we have been tracking year-over-year (YoY) generic deflation for all generic drugs that have a NADAC price. We once again weight all price changes using Medicaid’s drug utilization data. This month, deflation on oral solid generics and all generics was relatively flat at 15.3% and 12.3%, respectively (Figure 4). If you are a purchaser of generic drugs, this stability in price trends may be welcomed given broader issues in pricing predictability.
Figure 4
Source: Data.Medicaid.gov, 46brooklyn Research
7. Notable generic drug price increases this month
There are several clear contenders for most meaningful generic price increases this month, as there are some obviously large orange bubbles in Figure 3 above. Some of these are familiar names, like the special gastric version of metformin ER, which went from a NADAC per unit price of $2.37 to $5.16! Ouch. We also see notable price increases on a bunch of mental health drugs including paliperidone ER 3 & 6 mg and duloxetine 60 mg.
The gallery below shows the price trends for these agents over time.


8. Notable generic drug price decreases this month
Notable decreases in generic prices occurred in the following products:
Buprenorphine-naloxone tablets 8-2mg, a medication used to opioid abuse disorders, saw a 9% decrease. We highlight the tablets above simply because it isn’t the most commonly used version of the product, though it is far cheaper than the films.
Hydroxyzine HCL 25 mg tablets, a medication used to treat itching (and sometimes anxiety), saw a 39% decrease.
Gabapentin 300 mg capsules, a medication used to treat seizures and some forms of pain, saw a 8% decrease.
The gallery below shows the NADAC price trends for these agents over time.


Thanks to Nona Tepper at Modern Healthcare for featuring 46brooklyn CEO Antonio Ciaccia’s comments on some of the collateral damage that can come from inappropriate formulary exclusion decisions.
Shout-out to Zachary Brennan at EndPoints News for chatting with us about the Federal Trade Commission’s foray into the PBM marketplace and backwards tiering policies that often stick plan sponsors and patients with inflated tabs for brand drugs when much cheaper generic alternatives are available.
Big kudos to Rob Volansky at Healio for including our perspectives in his deep-dive into the variety of ways that PBMs can exacerbate the inflated nature of drug prices in the U.S.
Check out Ciaccia’s extensive interview with Dr. Jason Crowell at the Neurology Podcast about how Medicare Part D has hidden the benefits of generic competition for Tecfidera, a disease-modifying therapy for multiple sclerosis.
We appreciate the always-enlightening Joshua Cohen at Forbes for including our Copaxone “race to catastrophic” analysis in his recent overview of reform opportunities in Medicare Part D.
Additional thanks to Celine Castronuovo at Bloomberg Law for including some of our perspectives on the warped incentives in the PBM marketplace that warrant greater scrutiny from the FTC.
Lastly, thanks to Erin Brodwin at Axios for including Ciaccia’s perspectives on her two big scoops this month: the first being Venrock’s Series B funding for PBM startup SmithRx, and the second being Bessemer Venture Partners’ Series A funding for specialty pharmacy startup House Rx, thus ushering in another new slate of names we have to memorize that end in “Rx”.
Thanks to all those who came out to listen to 46brooklyn CEO Antonio Ciaccia’s keynote at the American Pharmacists Association 2022 Annual Meeting in San Antonio this past weekend. Much appreciation to the APhA team and to the panel of experts Nnodum Iheme, Emmanuel Ayanjoke, and Nick Trego for a great live event.
See us in action again this coming weekend at the American Pharmacy Cooperative, Inc (APCI) Annual Convention in Memphis.
In case you missed it, 46brooklyn is officially brining drug pricing to your earbuds, with the launch of the super-cleverly-named 46brooklyn Podcast, hosted by 46brooklyn president Ben Link. The first wave of reviews and comments have been well appreciated. If you haven’t checked it out yet, we highly recommend it. Our opening Drug Pricing 101 series is an excellent foundation for any understanding of the ways that we price drugs in the U.S.

We feel obliged to acknowledge that in our collective conscious, the issue that is drug pricing dysfunction in the United States is perhaps less consequential today than they were when we last gave our monthly review. This is because of the ongoing tragedy that is the conflict in Ukraine, and the associated loss of life.
Despite 46brooklyn’s disproportionately heavy focus on drug pricing mechanics in the U.S., we do have quite a foreign following as well. So, with our deep respect and advocacy for transparency and a free press, and recognizing that there are minimal opportunities to bring awareness of the war to those living within a state of active government suppression of independent media, we do believe in the power of words, even if they offer insufficient comfort to those currently impacted by this tragedy.
Our thoughts and prayers remain focused on those being impacted by this tragedy and our overriding hope is that peace would be restored to the region. But our words fail to capture the sentiment as well as Arnold Schwarzenegger, who delivered his best on-camera performance since Pumping Iron (please watch if you haven’t already, as it is well worth your time).
Slava Ukraini.