
Examining high drug markups: Introducing the Top 20 over $20
Last Wednesday, CMS updated their State Utilization databases, which most notably, extended the 2018 data to include the second quarter. Several hours later, we snuck out an update to all of our dashboards that rely on this dataset, rolling all of them forward to Q2 2018. We figured we may as well share the data as quickly as possible with you, even though we hadn’t gotten a chance to make heads or tails of it at that point.
Anyway, a week later, we’ve studied up and have come up with our “Top 20 over $20” list. In other words, the top 20 drugs dispensed through Medicaid managed care organizations (MCOs) with a markup of over $20 per prescription in Q2 2018. Think of it as a “top 40 under 40” list for generic drugs, with the main difference being that no self-respecting generic drug wants to be on this list.
A quick diversion down the bad data road
“Without accurate and timely data, it is not possible to analyze costs, utilization, or trends; evaluate benefits; or determine the quality of services being provided to members.”
Before we dive into our Top 20 over $20 list, we need to take you on a quick, but very important diversion. Unfortunately, one of the main stories in the new CMS data release was not the data itself, but instead what was missing from the data. After updating our dashboards, something immediately appeared to be wrong with New York’s Medicaid managed care data. In short, the drug cost per unit dropped to close to zero (Figure 1), which means that New York essentially stopped paying for drugs, someone submitted incomplete data, or the New York Medicaid data chief left to take a job on the offensive line for the Giants.
Figure 1
Source: 46brooklyn Research
Upon seeing these big data swings, we immediately went back to New York’s raw data – which you can download from CMS here – to investigate what may have happened. It turns out that New York reported what looks like a relatively complete set of units reimbursed and prescriptions, but very much incomplete costs. This actually makes it sound much better than it is. Of the 15,984 managed care prescription drugs (reported through national drug codes, or NDCs) reported by New York with non-zero volume, 13,349 or 84% of them had zero cost reported (Figure 2). As a result, we arrive at the following relationship:
Figure 2
Source: Medicaid.gov, 46brooklyn Research
To make the whole matter more perplexing, New York did report both cost and volume in their Medicaid fee for service program (Note: According to MACPAC, New York had approximately 74% of its patients in comprehensive managed care in 2016). So, somehow Medicaid was able to submit its fee for service claims data in a timely fashion to CMS, but not its managed care encounter data. This is especially ironic to us given that in CMS’ Medicaid and CHIP Managed Care Final Rule (CMS-2390-F) presentation, one of the main goals of the Final Rule is to “strengthen program integrity by improving accountability and transparency” (slide 3). Against the backdrop of this very admirable goal for managed care, we have a major reporting omission last week from the highest-spending managed care state in the country (Figure 3). To make matters worse, this omission came just one day after the New York Post published an article scrutinizing drug spending within the program and “CVS’s puzzling fluctuation in pricing for meds.”
Figure 3
Source: Medicaid.gov, 46brooklyn Research
So, if you work at CMS and are reading this, we really need a tighter process to review the submission and compilation of data into the State Utilization database. The need for this database has outgrown solely monitoring and checking manufacturer rebates. This database is also sorely needed to provide accountability and transparency on pricing and quality, and there’s no hope of this happening without accurate, timely reporting of data.
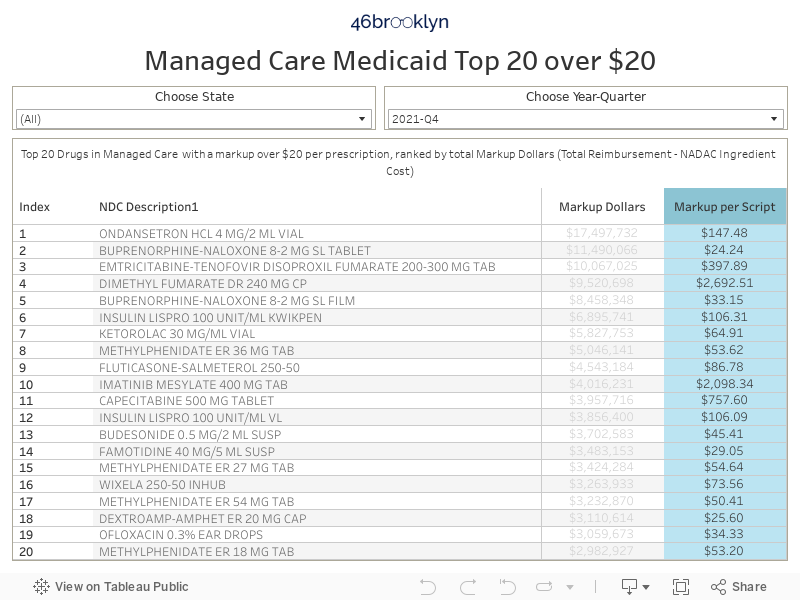
Top 20 over $20
Ok, now that we’ve warned you about what the data is missing, let’s get into the data that is there. Below, you’ll find a new dashboard we created for you to interact with that we call the “Top 20 over $20” list. These are the top 20 generic drugs in Medicaid managed care (ranked by total markup – what the state pays less the NADAC ingredient cost) that have a markup of over $20 per prescription. Why $20 per prescription? Because that is a ballpark number that we believe is excessive for the supply chain to take on a typical generic claim. As we have written about extensively, most pharmacy dispensing fee surveys result in break-even professional dispensing fees of around $10-11 per prescription. So once we get to $20, we feel comfortable claiming that this is pushing the bounds of what’s generally reasonable.
We’ve embedded the new Top 20 over $20 visualization below, and we’ve also placed it on our visualizations page (click here to go directly to the Top 20 over $20 page). Rather than just showing you a static summary of Q2 2018, we’ve put filters in the visualization so you can go back in time and get historical Top 20 lists, and also drill down to each state that is reporting any managed care data to CMS. Please note that when you view all states for Q2 2018, make sure to uncheck New York to remove the significant distortion that its bad data introduces to the overall national Top 20 (the tool default removes New York in Q2 2018).
Here are a few of our thoughts on the Q2 2018 Top 20 over $20 list:
Generic Suboxone costs are dropping, but where are the savings?
With all of the press on our nation’s opioid problem, it’s unfortunate to see generic Suboxone (Buprenorphine-Naloxone 8-2 MG SL Tablet) in the top position on our Top 20 list. Just a couple weeks ago, we wrote about how the NADAC price of this important addiction medication has been falling quite rapidly as of late. Unfortunately, Medicaid managed care programs as a whole do not appear to be realizing these savings due to the nature of their PBM contracts, most of which do not require actual pharmacy claim payments to be linked to an acquisition cost benchmark. We’ve presented a couple examples of states whose payments are really bifurcating from NADAC in Figures 4 (New Hampshire) and 5 (Massachusetts). If you are looking for other trend charts please use our Medicaid Drug Pricing Heat Map. Generic Suboxone has now been in the top spot for the last three quarters, largely due to the substantial volume that is (sadly) dispensed across the country to treat Medicaid beneficiaries in need of addition treatment.
Figure 4
Source: 46brooklyn Research
Figure 5
Source: 46brooklyn Research
Generic Abilify markups are more than “Good”
Fun fact. Out of the Top 20 over $20 generic drugs in Q2 2018 (excluding New York’s bad data), amazingly, 10 are mental health drugs (Aripiprazole, Duloxetine, Divalproex, Quetiapine). Of these 10, we have all six strengths of Aripiprazole.
Generic Abilify (Aripiprazole) has been out since late-2015, and has sported a NADAC price of less than $1 per tablet for over a year now. So, why are several states’ managed care programs still paying up to $6 per tablet for this drug (Figure 6)? This is a heavily-dispensed mental health drug within Medicaid that we would now consider to be “mature,” meaning that competition between a multitude of manufacturers (we count 18 “labelers”) has cut the true acquisition cost of this drug to the bone. But rather than states cashing in on the savings, PBMs have inflated the rates for Aripiprazole and pushed the margins to the supply chain, where they control how much margin goes to the pharmacy and how much goes to them. Of course, this means that rather than states controlling their own fortunes, for-profit administrative vendors are. Again, to look at the trend of what each state has paid for this drug, please use our Medicaid Drug Pricing Heat Map.
Figure 6
Source: 46brooklyn Research
Just to give you a sense of how out-of-line these Medicaid managed care rates are, in May 2018, the average NADAC price of Aripiprazole 5mg Tablets was $0.42 per unit or $12.60 per prescription. According to GoodRx, in May 2018, a “fair price” at the pharmacy would have been $1.18 per tablet or $35.56 per prescription. If we compare that to what states were getting charged for this same prescription in their Medicaid programs, here’s what we find:
Medicaid Fee-For-Service: California, Florida, Missouri, New Mexico, South Carolina, South Dakota all paid more than the GoodRx Fair Price, meaning that 13% of states with applicable data “overpaid.”
Medicaid Managed Care: Arizona, California, Florida, Georgia, Hawaii, Indiana, Kentucky, Louisiana, Massachusetts, Minnesota, Nebraska, Nevada, New Mexico, North Dakota, Ohio, Pennsylvania, Texas, Washington all paid more (and typically, a lot more) than the GoodRx Fair Price, meaning that 62% of states with applicable data “overpaid.”
As a start-up unaffiliated with an insurer and with far less leverage than PBMs and MCOs operating in the managed care space, the fact that GoodRx is achieving better prices than the biggest PBMs in the world is either remarkable acumen on the part of GoodRx, or it means that someone in the supply chain is taking advantage of sleepy Medicaid programs.
Generic Gleevec markup keeps on rising
There’s good news and bad news with generic Gleevec (Imatinib Mesylate 400 MG), which was the subject of our first report and the focus of a recent Bloomberg analysis on drug price markups. The good news is that its NADAC price dropped from $83.69 per tablet in Q1 2018 to $41.70 per tablet in Q2 2018 – a 50% decline over that time period (Figure 7). The bad news is that managed care programs (again, excluding New York) only reported a 7% drop in cost – going from a weighted average cost of $180.30 per tablet in Q1 2018 to $167.23 in Q2 2018. As such, the markup per prescription jumped a staggering 29% to $3,801 per prescription, with the overwhelming majority likely going to the PBM given that most retail pharmacies are not permitted to dispense specialty medications like Imatinib (they go through the PBM-dominated mail channel instead).
Figure 7
Source: Medicaid.gov, 46brooklyn Research
This would seem to be a significant conflict of interest for non-fiduciary PBMs. They can arbitrarily require certain medications to be dispensed through their own pharmacies, shield themselves from pharmacy competition, and set their margins however they wish. Regardless of whether or not a PBM is exploiting these powers, it’s easy to see how structurally, the incentive system is not necessarily aligned with the interest of the patient or payer – which in this case, is the taxpayer.
We should also note that another heavily-dispensed oral chemotherapy treatment drug is in the top 10 – generic Xeloda (Capecitabine 500 MG Tablet), with a nearly $1,000 markup per prescription in Q2 2018. While Georgia appears to have the largest disconnect between its managed care reported cost and pharmacy acquisition cost (Figure 8), if you poke around in our dashboards, you will find that most states’ managed care programs are far overpaying for this cancer treatment generic drug.
Figure 8
Source: 46brooklyn Research
Stomach-turning markups on generic Nexium
Several months ago, the U.S. Department of Health and Human Services (HHS) issued a report highlighting the dispensing of brand-name Nexium as the #1 driver of Medicare Part D overspending on brands with available multi-source generics in 2016. Now, in examining the Medicaid data, we have generic Nexium (Esomeprazole Mag DR 40 MG Cap) showing up in the 17th spot with an average markup of over $82 per prescription in Q2 2018. Some states are still paying more than $5 per tablet for a drug that now costs less than $0.50 per tablet (Figure 9).
Figure 9
Source: 46brooklyn Research
Maybe it still makes sense to dispense the generic over the brand in Medicare and pay the supply chain this markup, but given how rich the Medicaid rebate program is for brand name “innovator” drugs (of which Nexium is one), states may actually realize a lower net cost by dispensing the brand rather than paying such a steep markup to dispense the generic.
NOTE: We are currently working on a deep dive on Medicaid rebates that should hopefully make this topic a bit more clear when published. If you can’t wait for this to come out, read this fantastic report on Medicaid rebate economics by Magellan (discussion starting on page 7) or this presentation from Milliman on Single Preferred Drug Lists in Louisiana (slides 9-10).
The 2017 generic class
Lastly, we want to call out two generic drugs that are normally on our radar that have made the national Top 20 over $20 list – generic Renvela (Sevelamer Carbonate 800 MG Tab) and generic Viread (Tenofovir Disoproxil Fumarate 300 MG Tablet). Both of these drugs, which were introduced in the second half of 2017, crashed the 2018 Top 20 over $20 with markups north of $300 per prescription. Figures 10 and 11 show the heat maps for generic Renvela and generic Viread, respectively.
Figure 10
Source: 46brooklyn Research
Figure 11
Source: 46brooklyn Research
Interestingly, when we look up generic Viread in our Drug Pricing Dashboard, we get an even better visual of the cliff that the generic price fell off of in the middle of Q2 2018, which was widely anticipated prior to the generic launch. This drug clearly had its “generic Viagra (Sildenafil)” moment back in April (Figure 12), but alas, many states aren’t reaping the rewards (and these markups could be occurring outside Medicaid too). Unless contract structures between the MCOs and PBMs change, we’re not hopeful that heavy managed care states will see the benefit of this price reduction for years to come.
Figure 12
Source: 46brooklyn Research
What are you finding?
We’re curious how people are using our visualizations! What are you finding? What is perplexing you? We’re just providing one view among may valuable opinions out there. Tell us how you are using our tools and what you are find interesting by contacting us here.