
Drug price increases have slowed, but new analysis shows launch prices pushing costs into orbit
“To be sure, all this costs us all a good deal of money.”
The U.S. drug pricing system is complicated. But at its core is the premise that we as Americans willingly grant exclusive patents to drug manufacturers to entice them to bring new, hopefully-innovative, brand-name drugs into the market. It should come as no surprise that this profit-incentive yields new drugs with growing costs to the overall healthcare system.
We tolerate this sanctioned monopoly because there is an understanding that at some point, the exclusivity of that patent disappears, making way for cheaper generic versions of that brand drug to enter the market.
Ideally, the newer drugs that increase costs combine with the generic drugs that decrease costs, and things should generally even out and continue the steady churn of newer, better drugs without busting our budgets.
Yet, when the visionaries of the generic prescription drug marketplace peered into their telescopes and did the calculus to determine what the future drug marketplace would look like, could they have ever conceived of a generic drug that cost more than $20,000 per treatment?
Almost certainly not, and to their credit, how could they? Yet, here we are…
“Today, Gilead announced a plan to introduce a generic version of our leading cures for hepatitis C (HCV) in the United States more than a decade before the expiration of the patents ... These generics will be marketed by a subsidiary and will have a list price of $24,000 for the most common course of treatment ”
See, when evaluating prescription drug pricing, both the aggregate and the details matter all at once. And you can’t focus on brand drugs without also focusing on generic drugs. And you can’t focus on “drugs” without focusing on the individual drugs themselves.
The simple way of putting it is, we see no way to truly understand drug pricing without focusing on and exposing its nuances and complexities.
But for those that have been following our work, hopefully you’ll agree that we are constantly working to simplify as best as we can. With that, in order to better understand the totality of our prescription drug pricing conundrum – and recent analyses that show some disturbing trends with prescription drug launch prices – let’s take a journey into the great unknown starting with the drugs that society relies on to lower our overall costs: generic drugs.
According to Merriam-Webster, the definition of the word “generic” when used in the context of drugs is “not being or having a brand name.” But if you were to use the term to define say, a watch, its meaning changes to “having no particularly distinctive quality or application.”
THE SIMILARITY BETWEEN WATCHES AND DRUGS
Given our NYC-inspired roots, let’s roll with this wristwatch analogy as we prepare for takeoff. It used to be true that scattered on street corners all throughout NYC, you could buy all sorts of “generic Rolexes.” Except we didn’t call them that. We called them “Faux-lexes” It looks like a Rolex, feels like a Rolex, and likely, performs its intended function (telling time) just like a Rolex.
Source: nearsay.com
In fact, there is no reason why a well-made knock-off Rolex couldn’t be deemed functionally equivalent to a real Rolex – which is why fake Rolexes get steamrolled. There just isn’t a regulatory body that blesses and approves the functional equivalence between knock-off and authentic watches. But if there were, this analogy would be perfect for generic drugs. Before a generic drug can be brought to market the FDA must approve its bioequivalence to the brand-name medication it is copying.
Figure 1
Source: Center for Drug Evaluation and Research (CDER), U.S. Food and Drug Administration, 46brooklyn Research
But yet, we clearly know knock-off watches are “fakes” and most of us wouldn’t buy one anywhere close to the list price of an authentic brand-name watch. Actually, take a moment and think back to a time when you paid thousands of dollars or more for a product that had no particular distinctive quality or application (i.e. a generic product)? We struggled to come up with an answer … outside of healthcare.
Now consider Figure 2, which shows the 75th percentile, median, and 25th percentile of the one-month treatment cost (based on their “list price” a.k.a. Average Wholesale Price, or AWP) of all generic drugs launched in 2006 through 2019. This tells us that if you took all generic drugs launched in 2019, ranked them by cost and chose the one smack in the middle, it would have a sticker price of around $800 a month. It also tells us that the top 25% of the 2019 generic “class” carry a sticker price of more than $1,800 a month.

Figure 2
Source: 46brooklyn Research (derived from raw data from Elsevier Gold Standard)
What happened here? When did generic drugs stop being “generic”? Or put more bluntly, why are “fake Rolex” drugs getting priced at “real Rolex” levels?
To answer that question, we need to first step away from generic drugs, strap on our GMT 1675, and venture into the great abyss of brand-name drug launch pricing.
INTRODUCING THE 46BROOKLYN DRUG PRICE LAUNCHPAD
Recent reports have demonstrated that brand-name medication prices are not increasing at the same rate as prior years. We’ve highlighted similar trends in our digging as well. While slowing list price increases can be helpful, and certainly understandable given the amount of coverage drug prices have gotten over the previous year, it misses one of the key points within the brand drug marketplace. Brand-name drug cost pressures have less and less to do with year-over-year price increases and more to do with the launch prices of new brand name medications when they initially come to market.
As the following visualization demonstrates, over time, the price of all the newly minted brand name products at their initial launch is rising rapidly over time (note that the y-axis is a logarithmic scale!). Behold our latest drug pricing dashboard: the 46brooklyn Drug Price Launchpad.
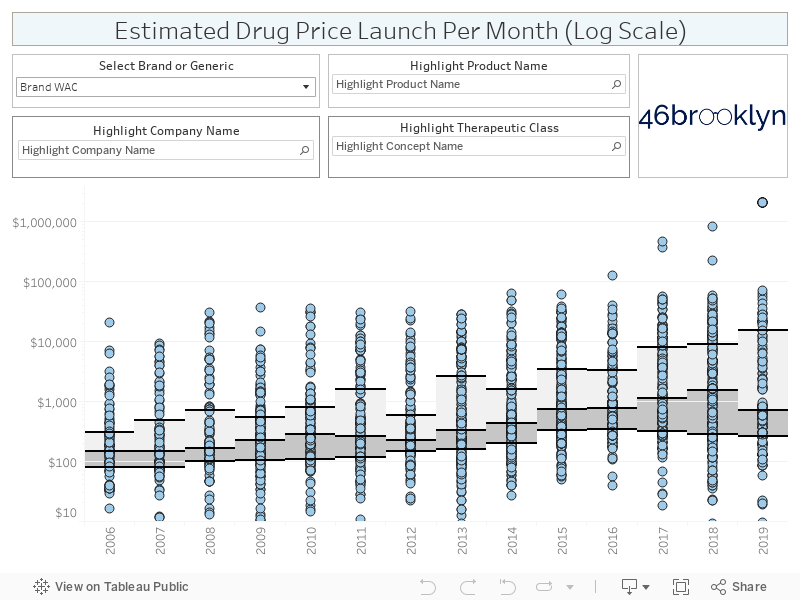
Here is a quick tour of the new dashboard. For more detail on how we created the Drug Price Launchpad (and its limitations), please see its dedicated visualization page.
First, each bubble is a different brand-name drug. All drugs are grouped by their launch year (the x-axis) and ranked by their launch cost for a one-month treatment.
Estimating the launch cost was clearly the most difficult part of this exercise, which means we had to beef up our resources at 46brooklyn. To do so, we used Elsevier’s Gold Standard Drug Database (yes, we used your donations to purchase better weaponry) to find each drug’s Wholesale Acquisition Cost (WAC) per unit at launch. Then we painstakingly estimated the units for a one-month course of treatment for each drug (i.e. “common quantities”). This was an iterative (and manual) process, which was conducted by the newest addition to the 46brooklyn team, pharmacist and pharmacy benefits pro Ben Link.
We were able to find common quantities for roughly two-thirds of all drugs within the the bowels of the Q1 2019 CMS Medicare Part D formulary database that we purchased to build the Part D Drug Pricing Ski Slope viz. We then manually went through the remaining drugs and used DailyMed to calculate dosages based on package inserts. It was a maddening process. If we’ve learned anything it’s that we desperately need to add a good comprehensive dosage database to our public data wish list. Anyway, it goes without saying that there is a slim chance all of the common quantities (and therefore one-month treatment costs) are correct in this viz. If you see anything that looks blatantly wrong, shoot us a note and we’ll research and fix it.
Note: Not all drugs are dosed in (or can be converted to) one-month treatments. Some are one-time treatments (i.e. Zolgensma). But in general, the majority of drugs have, to the best of our abilities, been assigned a cost for a one-month treatment. However, knowing this, it is not appropriate to annualize the costs presented in the dashboard for every drug.
Moving to the top of the Launchpad, you’ll find a filter on the top left that allows you to switch from brand to generic drugs. Please note that we calculate one-month treatment launch prices for generic drugs based on AWP instead of WAC, as we have found that not all generic manufacturers publish WAC. 🤷♂️ Plus, AWP is what most payers’ generic costs are linked to (not WAC) so it’s a more appropriate benchmark for generics anyway.
You will also see three highlight blocks at the top of the viz – one for product name, one for drug labeler (“company name”), and one for therapeutic class. Simply start typing what you are looking for into any of the three highlight blocks, and Tableau will highlight it for you on the chart.
The last thing we will point out is that for each year, you’ll see three lines with two shaded blocks. These provide some basic stats for the folks that are into that sort of stuff. The top line is the 75th percentile price (i.e. upper quartile). The middle line is the 50th percentile price (i.e. median). The bottom line is the 25th percentile price (i.e. lower quartile).
Another note: The stats are not utilization-weighted in any way. The tool is just meant to be able to evenly view and assess all drugs launched in any given year, irrespective of volume.
3… 2… 1… BLAST-OFF: BRAND-DRUG LAUNCH PRICE TRENDS
To see the trends in the key stats a bit clearer, let’s drop all of those bubbles out of the picture and see what happens.
First, here is the 25th percentile of all brand-name drug one-month treatment launch costs, by year. It’s up 226% from 2006 to 2019.
Figure 3
Source: 46brooklyn Research (derived from raw data from Elsevier Gold Standard)
Now here’s the median (50th percentile) – up an astonishing 934% between 2006 and 2018, before getting cut over half in 2019 (still up 381% from 2006).
Figure 4
Source: 46brooklyn Research (derived from raw data from Elsevier Gold Standard)
Now, let’s take a peek at the 75th percentile, which in 2019 was $15,310!

Figure 5
Source: 46brooklyn Research (derived from raw data from Elsevier Gold Standard)
But no so fast … this sky high number is largely driven by Zolgensma, which was launched this year in 22 different strengths each with a cost of $2,125,000. If we exclude Zolgensma from this chart, the 75th percentile launch cost drops to a much more “reasonable” $4,626, up 1,397% from 2006. We were actually pleasantly surprised to see both the median and the Zolgensma-adjusted-upper-quartile fall so precipitously from 2018 to 2019 … although a ~1,400% increase in the 75th percentile from 2006 to 2019 hardly seems like a reason to celebrate.
Figure 6
Source: 46brooklyn Research (derived from raw data from Elsevier Gold Standard)
Are Brand list prices fake? Sometimes.


For those that have ever had the great fortune of witnessing a shuttle launch, you’ll typically notice that shortly after take-off, the rocket will shoot into the sky so high that it appears that the ship completely disappears into the heavens. But of course, barring tragedy, that shuttle inevitably has a very clear destination. The actual flight path is much shorter than its seemingly limitless trajectory.
This is not dissimilar from the current state of affairs for brand-name drugs. The prices appear to be skyrocketing, but for many of those drugs, the actual landing spot in terms of net cost is much more understated.
We already know (and agree) with the criticism we will inevitably receive on this analysis. For many large government and private payers, list prices on brand-name drugs are “funny numbers” as they do not include significant rebates received after the drug is dispensed (although, this is not true for small employers or patients in the deductible phase of their coverage). This has been highlighted very eloquently by Drug Channels Institute’s Adam Fein – the “gross-to-net bubble” is ballooning.
No matter how hard we try, we still can’t pry open any data to be able to accurately quantify hidden rebates by drug and payer type. Having said that, we may be getting closer. The VA recently published all of its historical contracted pricing, which has been quite interesting to study (teaser: the “Big 4” currently gets a 79% discount off Humalog’s list price – quite a deal compared to the 50% discount on Eli Lilly’s authorized generic), and will most certainly be the topic of a future 46brooklyn report.
So yes, brand drug launch prices are going up, and aggressively so. But escalating rebates cloud the actual net cost impact of higher list prices, leaving us very much in the dark on what all of this means.
When a Brand Becomes a Generic, Fake Prices Get Real
What we do know is that one day, these new brand drugs, priced in line with a luxury vehicle, will inevitably lose their exclusivity and generic copy-cats will hit the market. And then all of the sudden, these pre-rebate, sometimes-fake brand drug list prices become very real.
That’s because each newly-minted generic is launched with a price (specifically, an AWP) resembling the equivalent brand name drug from which it was born. And then a payer’s PBM plucks that generic AWP off the shelf (actually, out of a database) and – through some impressive mathematical gymnastics – uses it to price generics for its clients.
To demonstrate the connection between brand and generic pricing, we attempted to identify all brand-name drugs that lost exclusivity between 2005 and September 2019. Altogether, we found 1,247 different drugs that fell into this category. For each brand drug in the sample, we found the first generic version brought to market approved under an abbreviated new drug application (ANDA) and compared the generic’s launch AWP with the AWP of its equivalent brand the month prior to its launch.
Here is what we found:
Generic Introduction AWP Discount
The key takeaway for us from this analysis is that 8 out of 10 (77%) of newly-released generics were launched with an AWP that was a 0-15% discount to the brand-name medication it was designed to replace. In other words, the majority of generic drugs that come to market are brought to market at a relatively modest AWP discount.
But not to worry! As more generic manufacturers come to market, the AWP falls precipitously … right?
Wrong!
Actually, AWPs are rarely adjusted down over time as more generic competition comes to market. To illustrate how sad a state of affairs AWP is in for generics, we found all generic/ANDA national drug codes (NDCs) that had both a National Average Drug Acquisition Cost (NADAC) and an AWP price in each month between January 2014 and June 2019. In case you were curious, that’s 6,986 NDCs. Keep in mind, AWP is the fake list price of the drug, while NADAC represents regularly-surveyed pharmacy invoice costs to acquire prescription drugs from wholesalers. NADAC is a great public data source to track market trends on drug prices, but keep in mind, it does have some of its own limitations. Regardless, when it comes to generic drugs, AWP = fake; NADAC = good approximation when data is available.
So the question we had was of these nearly 7,000 drugs, how many experienced a decrease in NADAC and AWP over time.
The answer is shown below. Of all these generic NDCs, 70% experienced a NADAC price decline, at least according to pharmacies reporting their invoice costs to CMS. Conversely, generic manufacturers only reduced their AWPs on 2% of the exact same NDCs.

Figure 7
Source: 46brooklyn Research (derived from raw data from Elsevier Gold Standard)
Also note that 81% of all NDCs experienced literally no change in AWP (again over five and a half years!), while only 9% of NDCs had no change in NADAC. We’ve called generic AWPs “stale” many times in the past. We probably were too kind. With these sort of stats, AWPs are as stale as a crusty piece of moon cheese.
When NADAC goes down, AWP remains stable
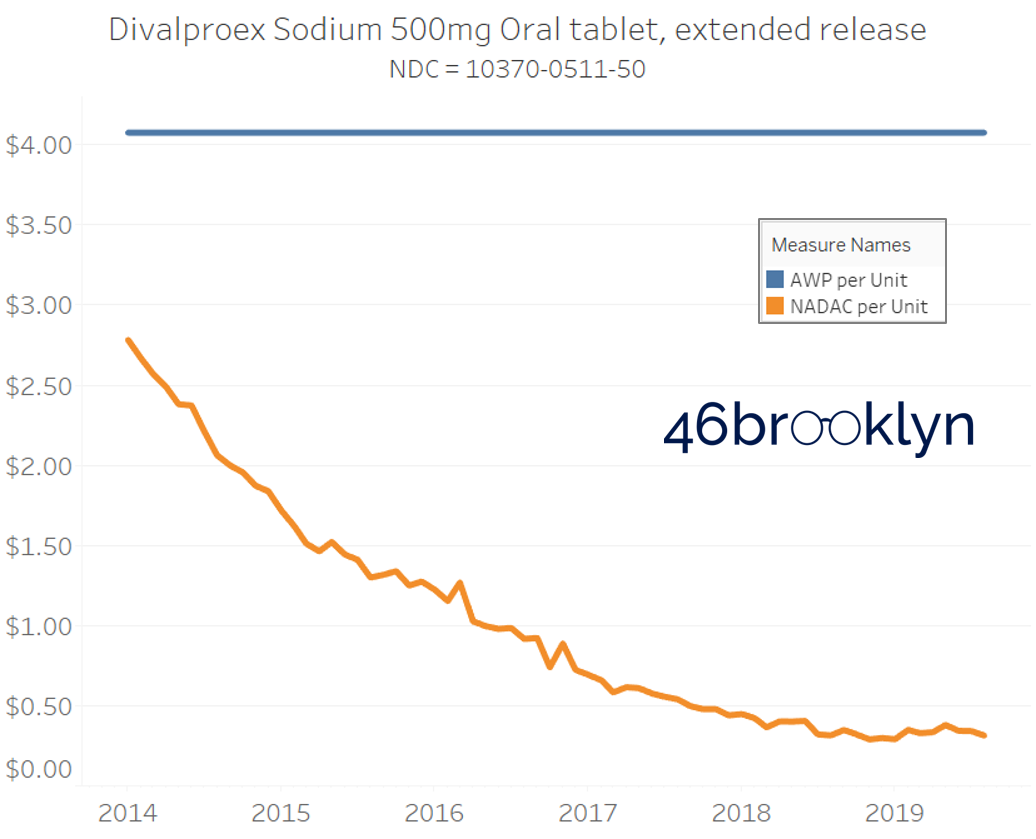
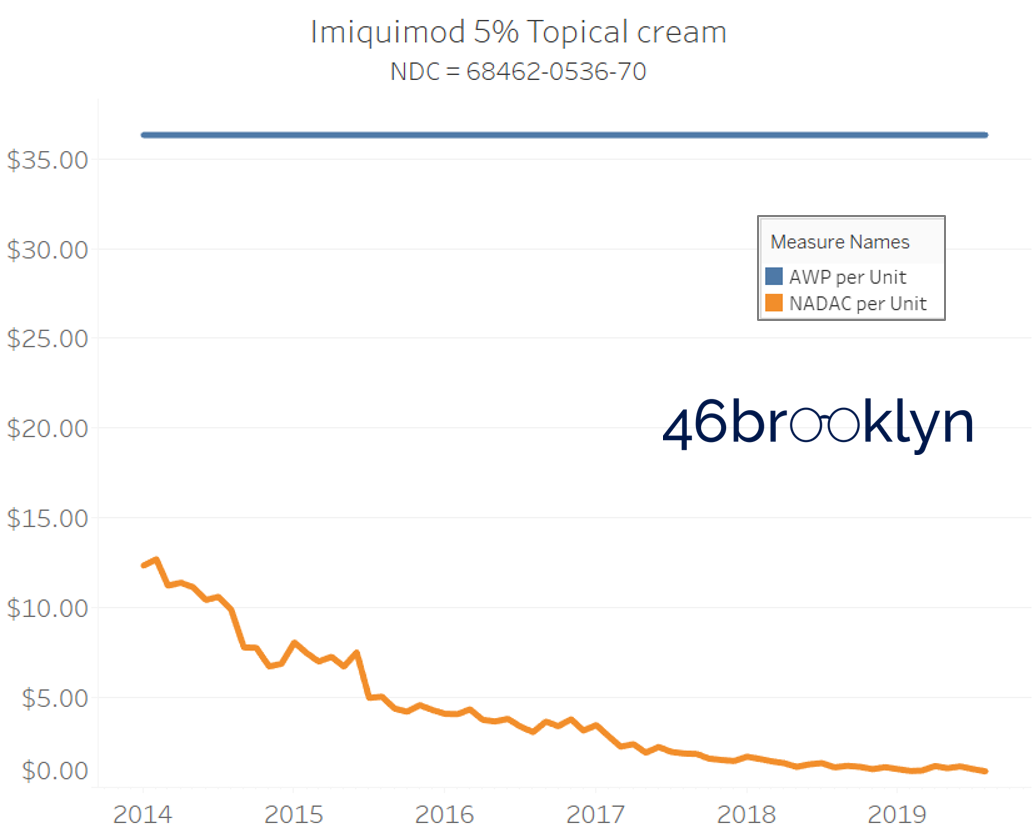
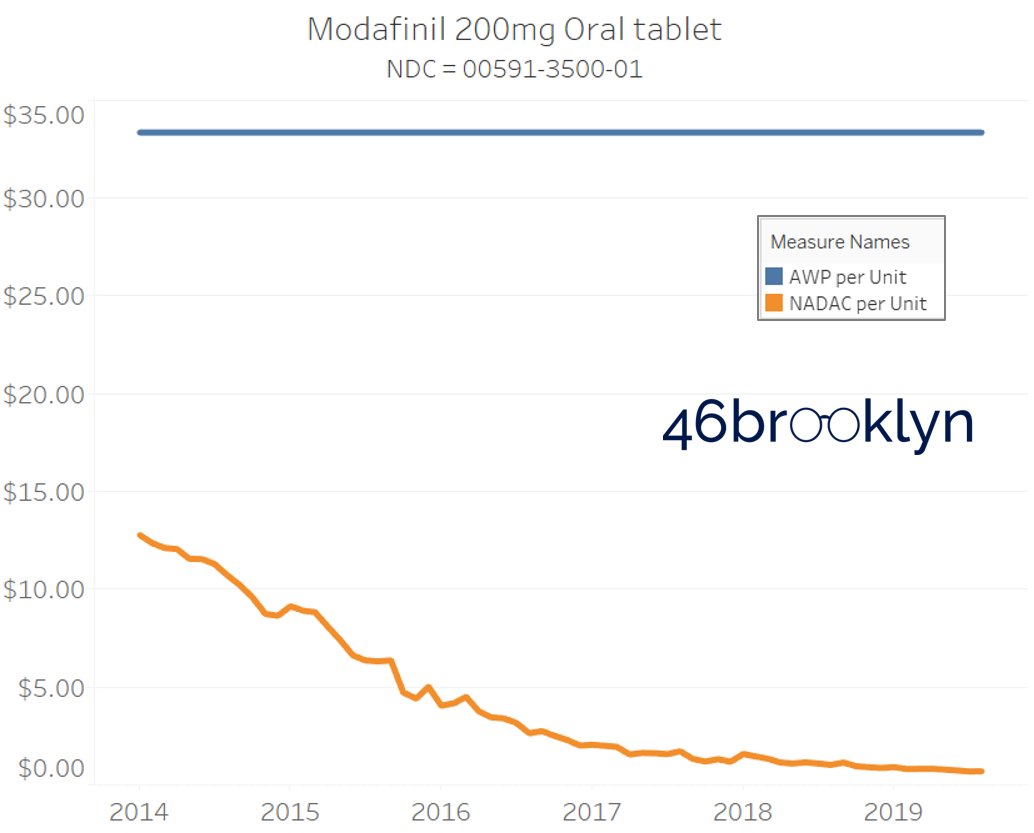
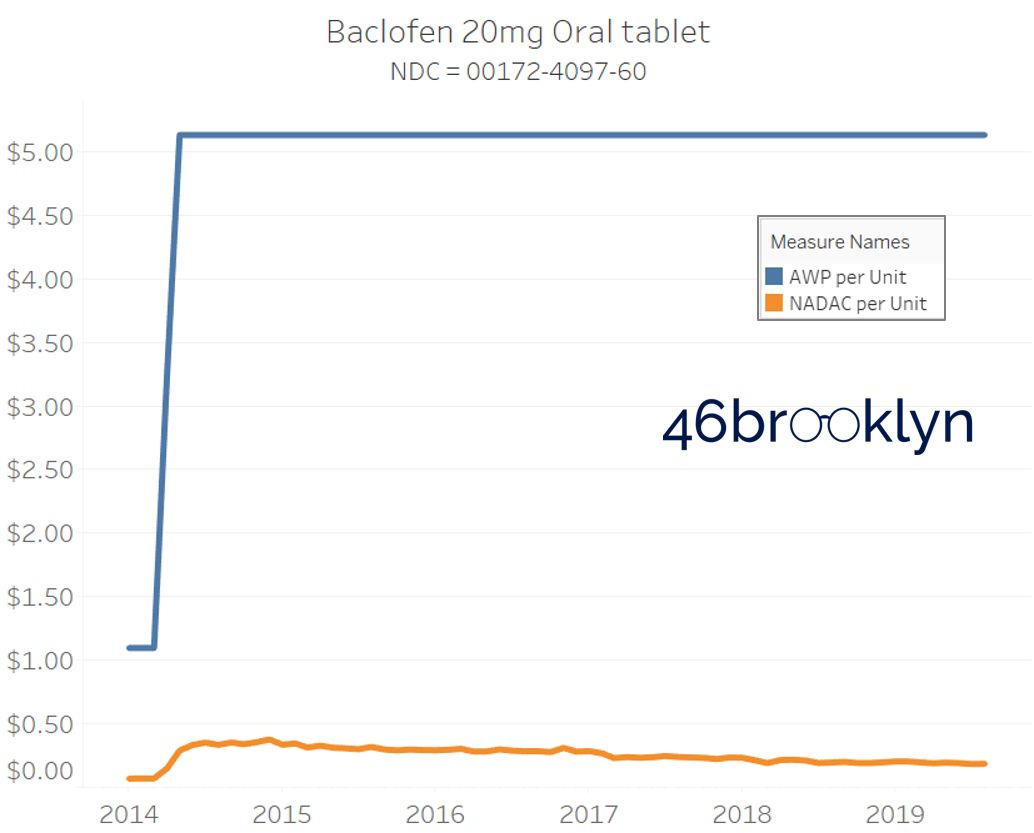
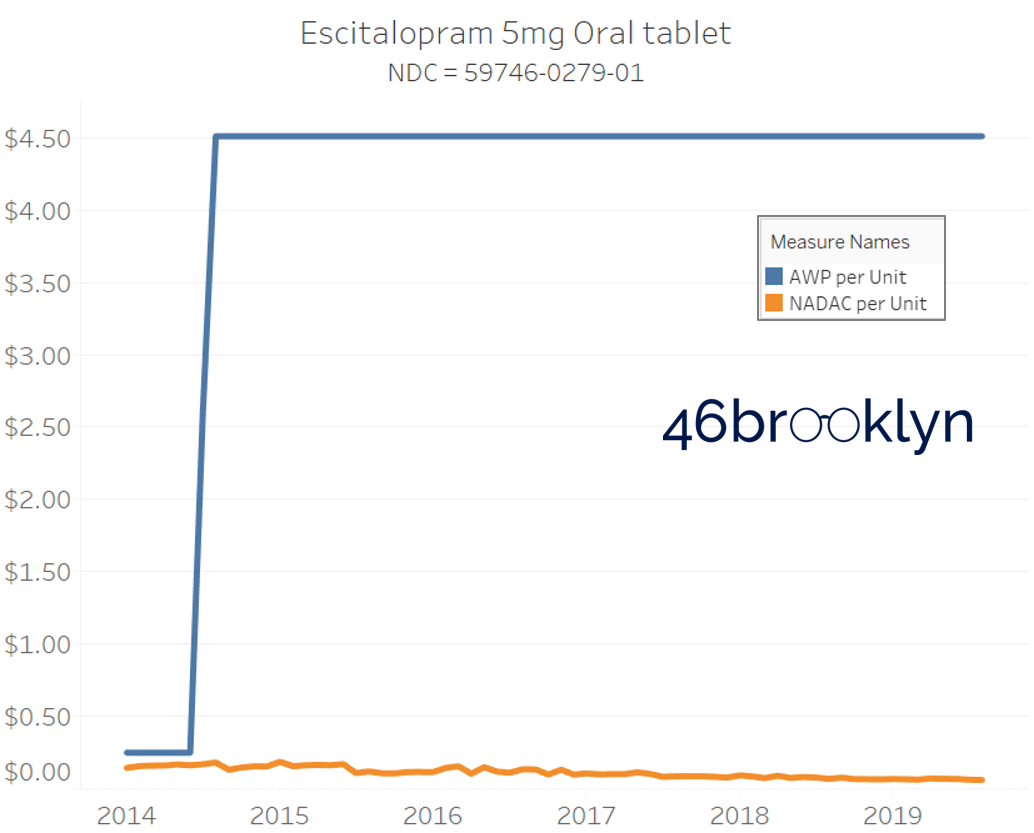
It may be helpful to present some more charts to show how badly generic manufacturers have fallen asleep at the wheel when it comes to reflecting market clearing prices in their AWPs. Of the 5,686 NDCs that had no change in AWP over this 5+ year period, 648 actually lost two-thirds or more of their value based on NADAC. Duloxetine is the poster child within this group, sporting a 97% decline in NADAC over this period with not a blip in AWP. The following chart gallery shows Duloxetine’s price trend, along with nine other drugs that we randomly selected from the hundreds in this most egregious AWP price distortion group.
Note: all prices in the following chart gallery are per unit


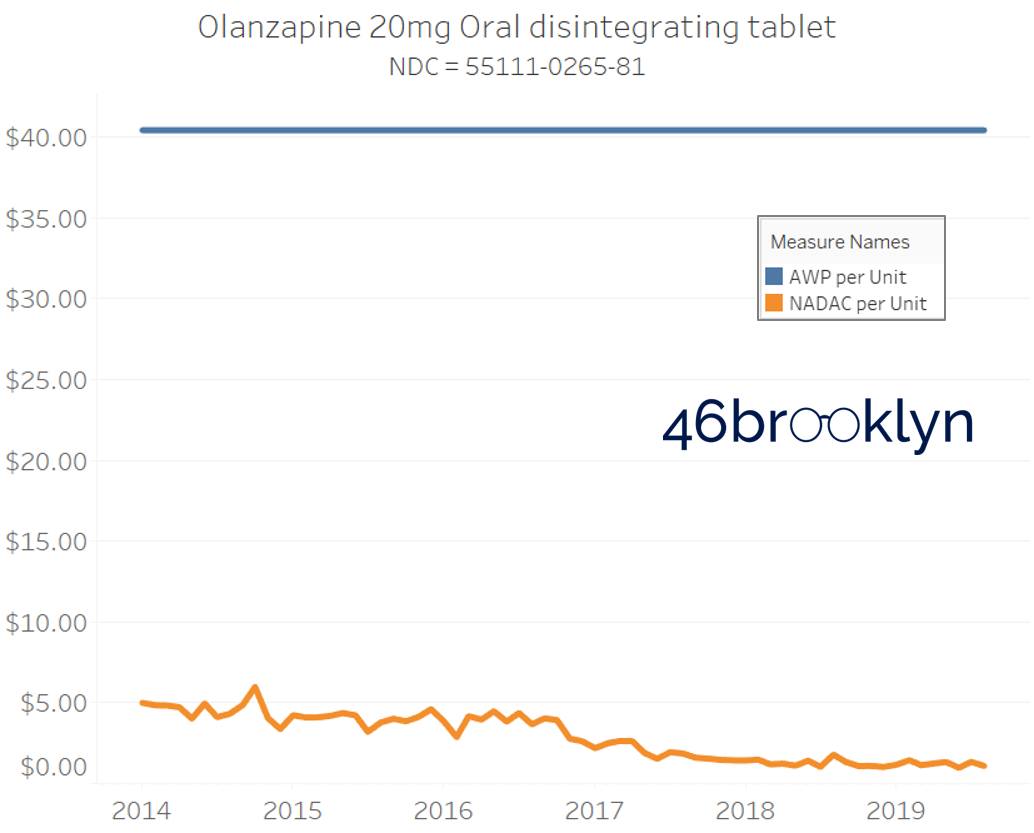
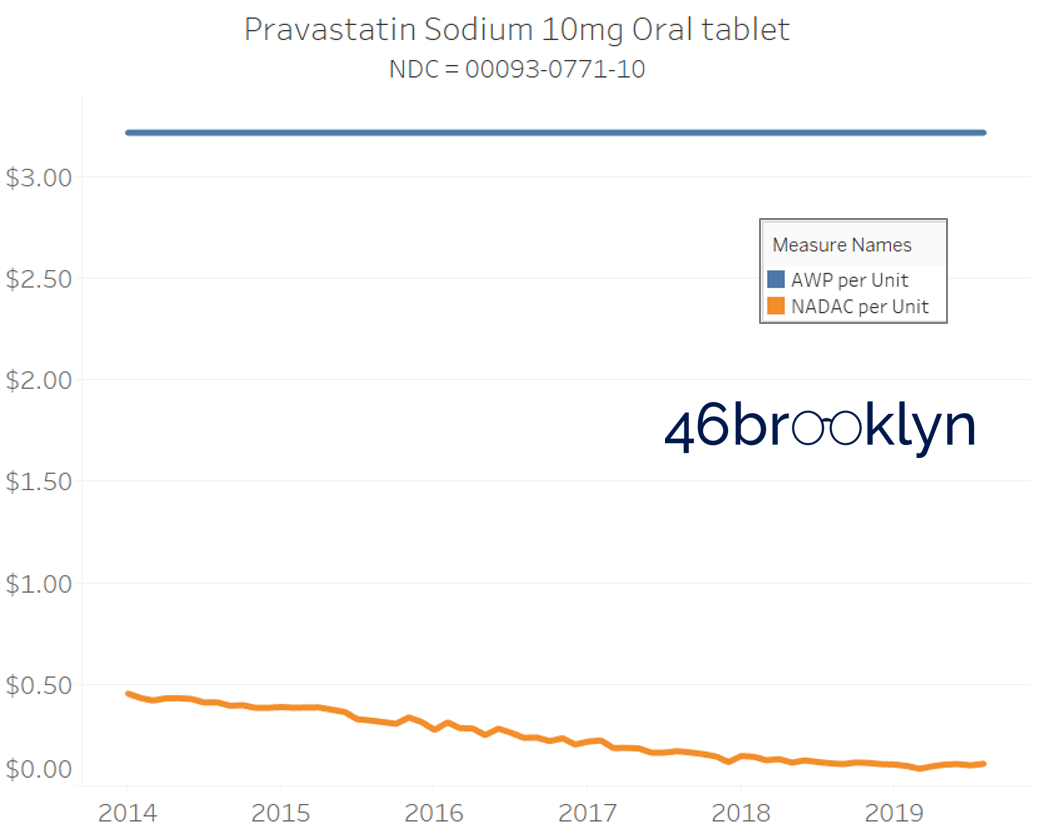
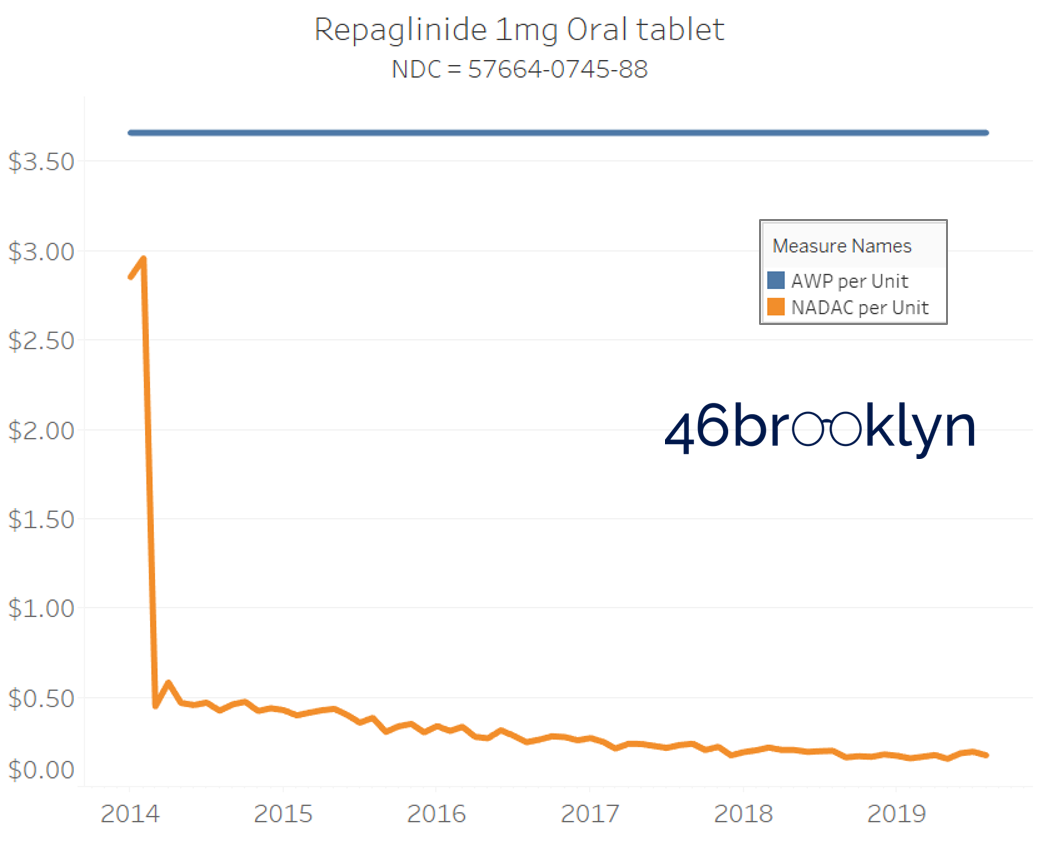
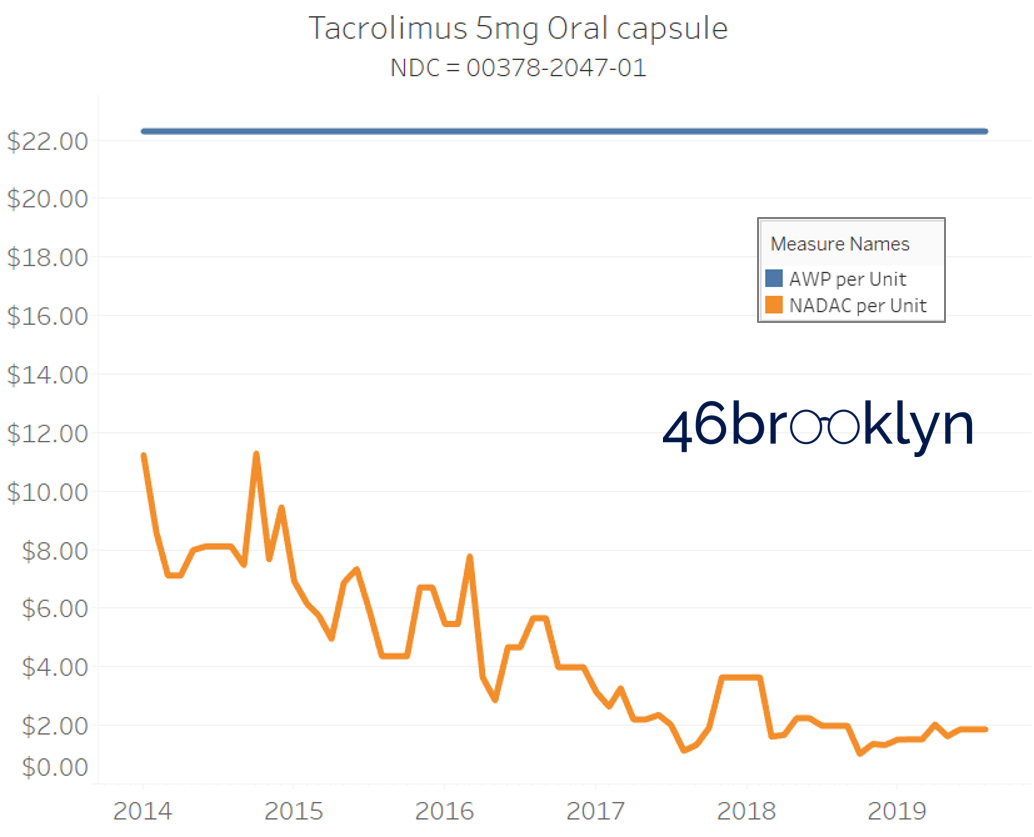
Sick and Poor
The preceding charts, and several others that we will throw at you between now and the end of this report, have two trend lines. The blue line is the AWP per unit while the orange line is NADAC per unit. When we have done cost comparisons in the past, we have traditionally compared NADAC to Medicaid’s reported cost by drug. We coined the gap between the two measures “markup,” which we define as the total margin actually available on a drug for the supply chain to divvy up.
The gap between between AWP and NADAC tells us something different. It tells us the maximum profit opportunity for the supply chain. The larger the gap, the bigger the opportunity for the supply chain to profit. But just because the opportunity is there does not mean it will be realized.
This is very similar to the speedometer on your vehicle – just because the vehicle is designed to go to 140 mph doesn’t mean you will push it that hard. But you have the opportunity to do so if you can get away with it.
Therefore, going forward we will start calling the AWP-to-NADAC gap Supply Chain Profit Opportunity – pronounced “Sick-Po.” If you have a hard time remembering this, just remember that if we keep relying on AWP to set drug prices, we’ll eventually get “sick” and “poor.”
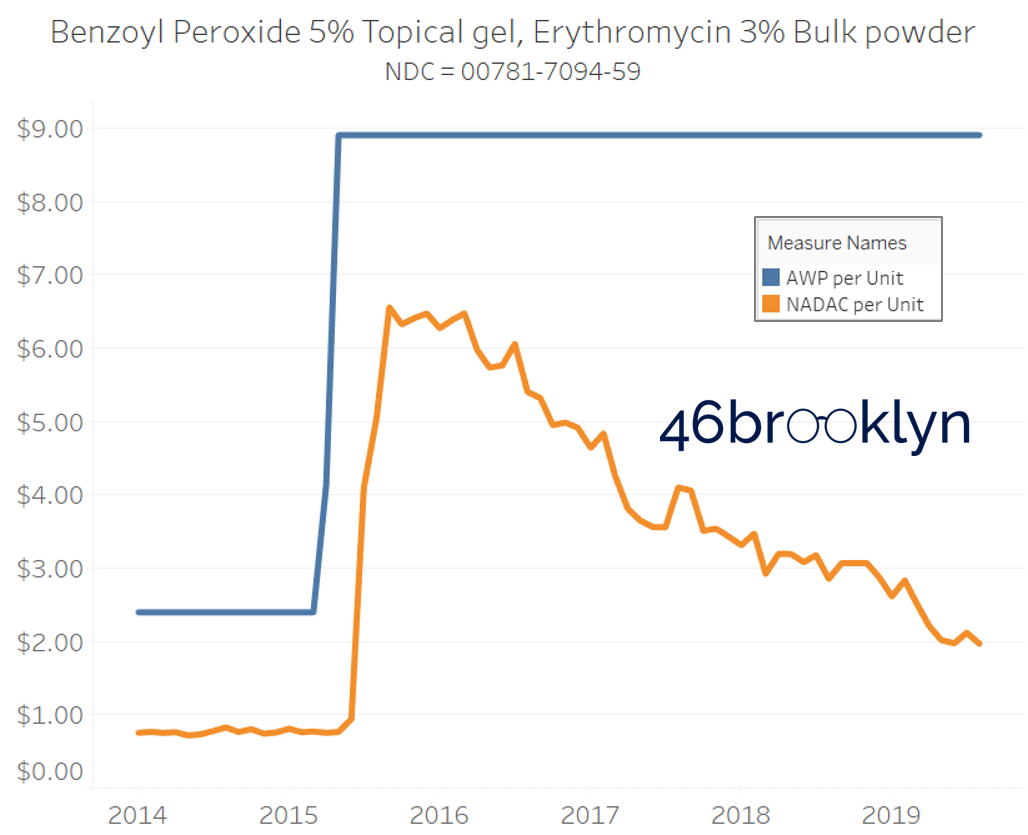
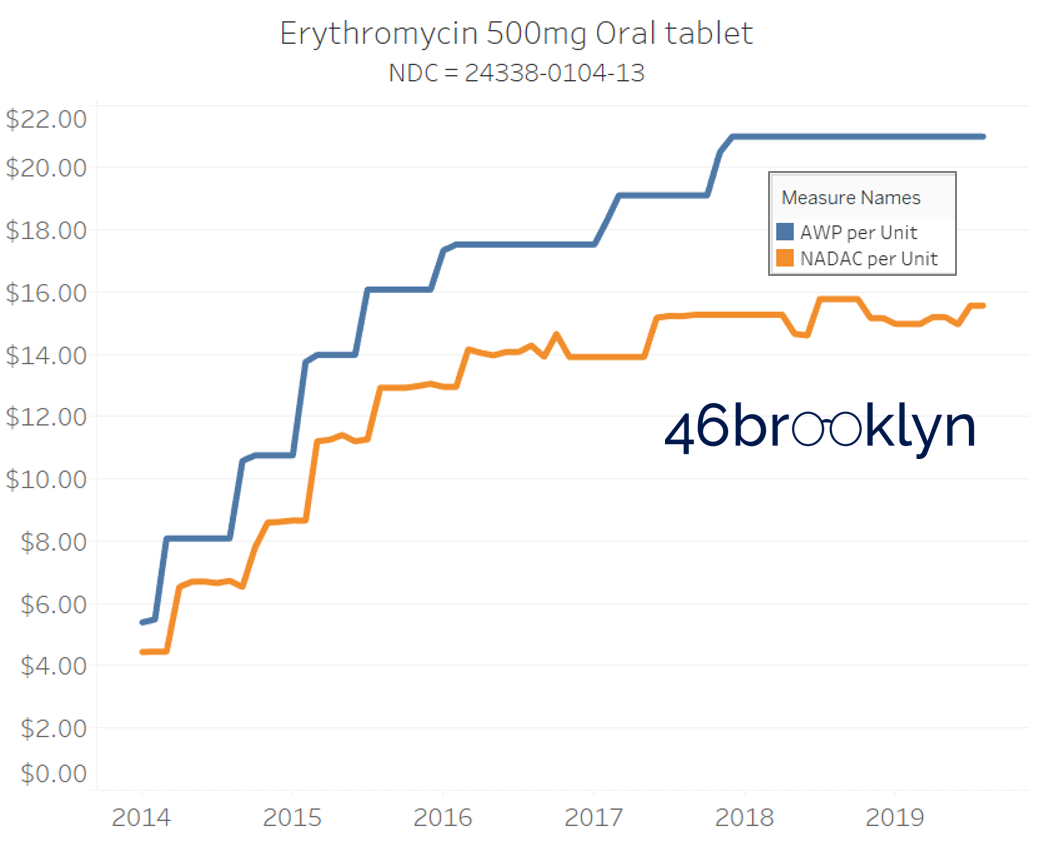
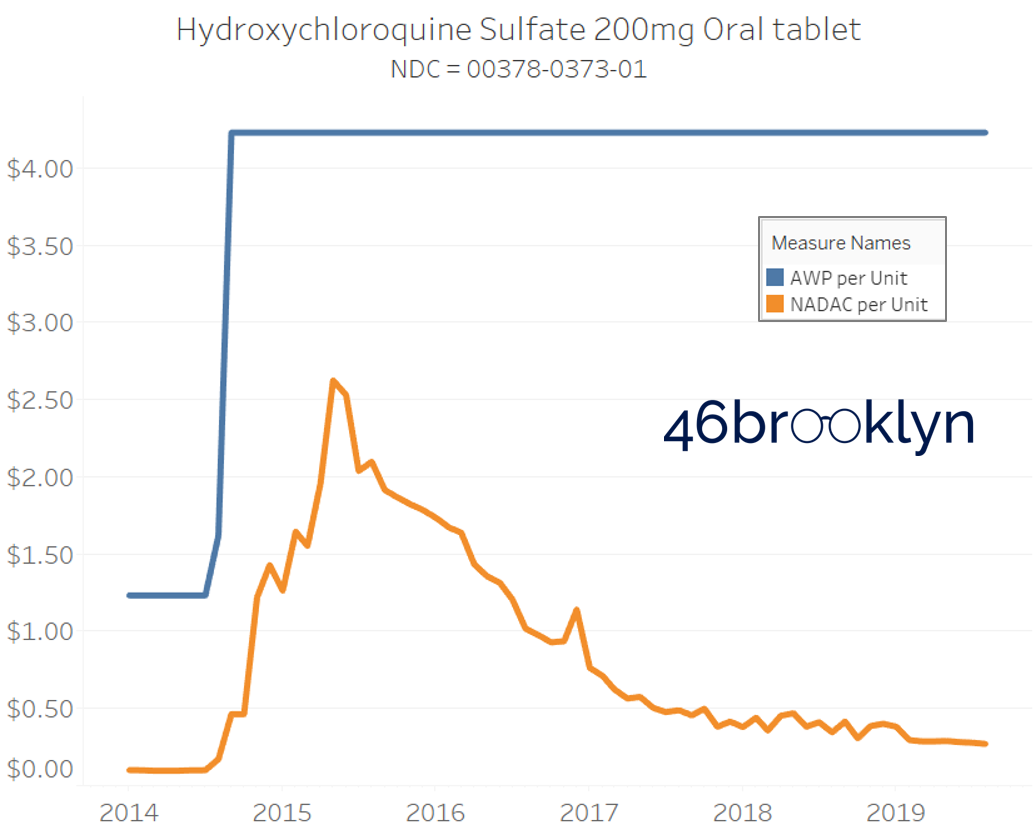
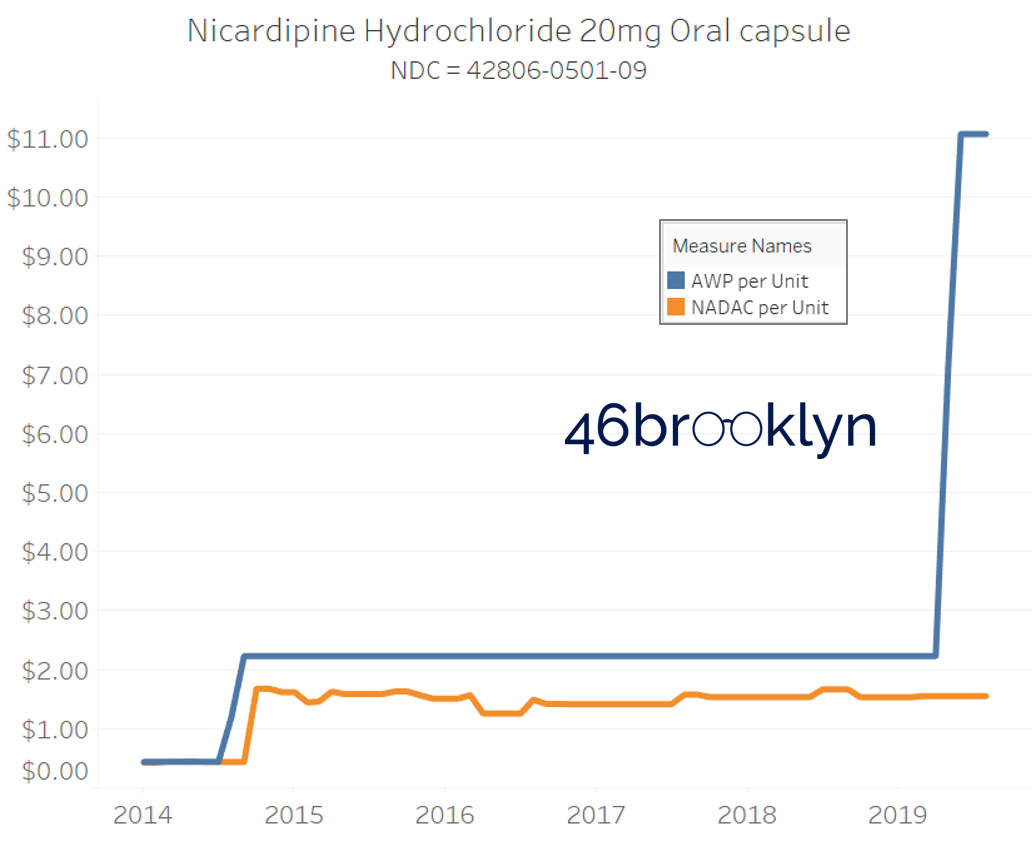
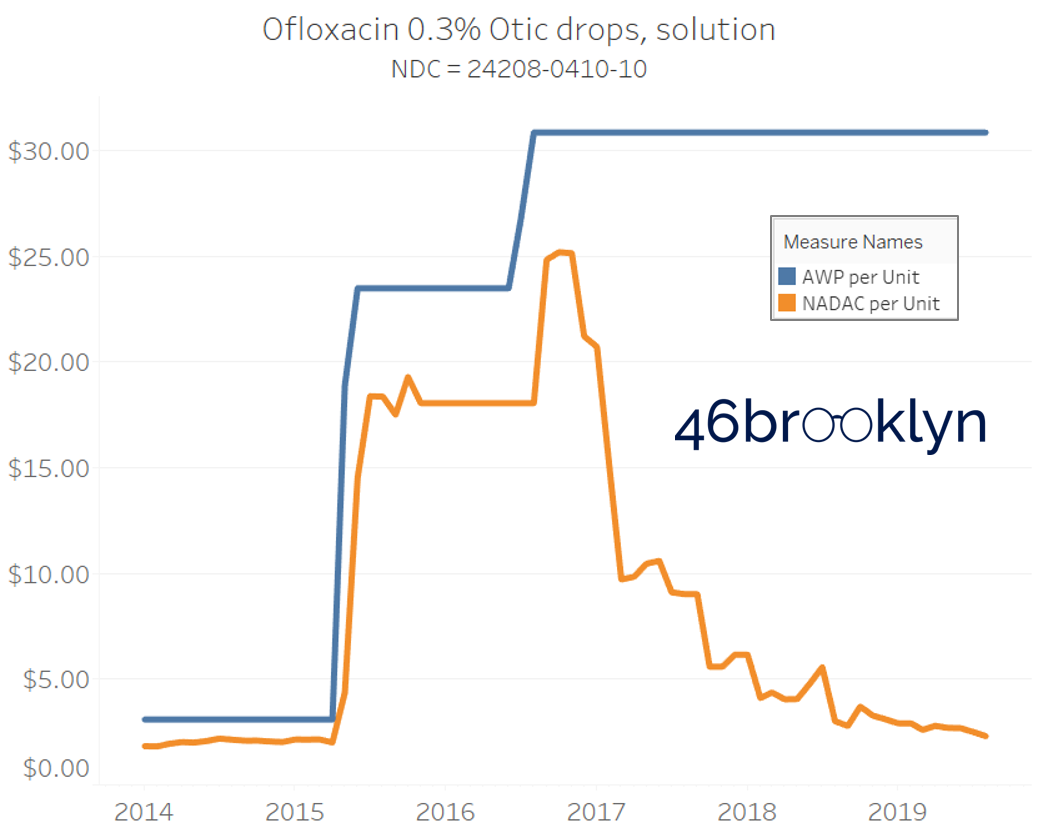
When NADAC Goes Up, AWP Goes UP
Returning to our stacked bar chart in Figure 7, we see one final takeaway. Note that there are a similar percentage of NDCs that increased in both AWP and NADAC over the 5+ year period. Isn’t that strange? When the NADAC drops, AWPs just sleep through all the commotion. But when NADACs rise – whether it’s due to a real or manufactured drug shortage – they all of a sudden wake up and promptly capture that market-based upward movement (and then some, usually).
The poster child in this group is generic Plaquenil (hydroxychloroquine), which was the subject of the second report we ever wrote. In the report, we were simply pointing out how after the shortage on this drug subsided and acquisition costs started falling, Medicaid managed care plans continued to pay stubbornly high “shortage” prices. Well, now we know why! Hydroxychloroquine has a very high SCPO. As shown in the chart gallery below, when the shortage hit, the AWP was jacked up and never brought down, allowing PBMs to arbitrage the SCPO long after the drug was cheap again. Enjoy flipping through the chart gallery below, which shows some sick SCPOs on hydroxychloroquine and nine other randomly-selected NDCs from the over 1,000 that increased in AWP over the past 5+ years.
Note: all prices in the following chart gallery are per unit


“AWP” AIN’T WHAT’S PAID … BUT IT IS
In summary, this is a case of “heads I win, tails you lose.” In general, when the generic marketplace pressures a drug down, nothing happens to its AWP. But when a generic drug’s acquisition cost goes up, its AWP follows (Figure 8). This puts upward pressure on overall median AWPs over time (up 8% between 2014 and June 2019), diverging from falling median acquisition costs (down 32% between 2014 and June 2019).

Figure 8
Source: 46brooklyn Research (derived from raw data from Elsevier Gold Standard)
As a reminder, all of the analysis presented so far was performed on an unweighted stable selection of NDCs. It didn’t even include the impact of new generic NDCs coming to market over time at higher AWPs thanks to higher list prices on their predecessor brand-name drugs.
We can use Medicaid utilization data to put the whole story together. We simply connected 2014 through Q1 2019 state drug utilization data together with AWP and NADAC unit costs and then calculated the weighted average unit cost each year using both pricing benchmarks.
As shown below, between 2014 and Q1 2019 Medicaid managed care’s weighted average NADAC per unit fell by 37%, while its weighted average AWP increased by 22%.

Figure 9
Source: 46brooklyn Research (derived from raw data from Data.Medicaid.gov and Elsevier Gold Standard)
So long that payers are paying for generic drugs based on AWP, we have quite a conundrum. A payer approached by its PBM with an AWP-linked contract for generic drugs can work hard to negotiate a steeper discount. But no matter how successful it is in this endeavor, it remains anchored to a benchmark price that is loaded with SCPO. In other words the price:
Starts just modestly cheaper than the brand drug
Does not go down with market-based deflation
Goes up with market-based inflation
Put bluntly, it’s a broken benchmark that is designed, in aggregate, to go higher. And as we add newer, more expensive generics to the mix (thanks to newer and more expensive brands), it only gets more broken. The payer’s AWP-linked contract is loaded with rocket fuel, driving them further and further into the atmosphere, when their costs should instead be driven down by the gravitational pull of supply and demand.
Houston, we have a problem

It’s easy to assign blame when it comes to drug pricing. Blame brand manufacturers for shifting from closely watched and scrutinized price increases to higher launch prices. Blame generic manufacturers for rarely lowering AWPs, but consistently raising them when opportunity knocks. Blame pharmacy benefit managers (PBMs) for pushing up generic average wholesale prices (AWPs) by demanding higher and higher rebates on their predecessor brand equivalents and then pricing generic drugs to clients based on those inflated AWPs. Blame them again for using the ambiguity of pricing to grab hidden spreads. Blame pharmacies for showing PBMs how to do it decades ago when it was pharmacies who capitalized on the arbitrage of the system. Blame wholesalers who lack the incentives to push lower-AWP drugs into the pharmacy marketplace.
Who should we blame for high drug prices?
Everyone.
But blaming everyone is not going to get us very far. It’s not that the players don’t deserve the blame (they do); it’s just frustratingly unproductive to do so. If we really want to fix all of this, we collectively need to stop hating the players and start hating the game.
If we had to sum up everything we’ve written about the game today, and frankly, since we started writing about the system last year, it’s this – the game’s primary problem is that it is all predicated on the existence of, and reliance upon, fake prices. Fake prices for brand-name drugs beget fake prices for generic drugs. Some people pay the fake prices, while some who are more in on the game get better discounts off those fake prices. But at the end of the day, all of these fake prices add up to a huge opportunity for the players to suck very real money out of our health care system, leaving us SICK and POOR.
And who can blame the players for doing this when they have the incentive to do so? If our policies simply work to shut and lock each door as we find it open, the players will simply build more doors to replace them. In other words, if the incentives of the game reward exploitation, exploitation will persist.
We have to change the incentives of the game to reward players for doing what we want them to do. But we are galaxies away from having this discussion. That’s why, in our view, a good place to start is by pulling ourselves out of this fake price black hole in which we are currently trapped and gravitating to some real drug prices that the public can trust.