
What’s happening to generic drug prices? April 2019 NADAC Survey Update
It’s that time of the month again: NADAC survey results week, which means it’s time to check in on generic drug price changes. Well, at least it was NADAC survey results week a couple weeks ago … but we’re just getting around to publishing on this month’s survey results. Better late than never! We hope you’ll forgive us. We’ve been busy.
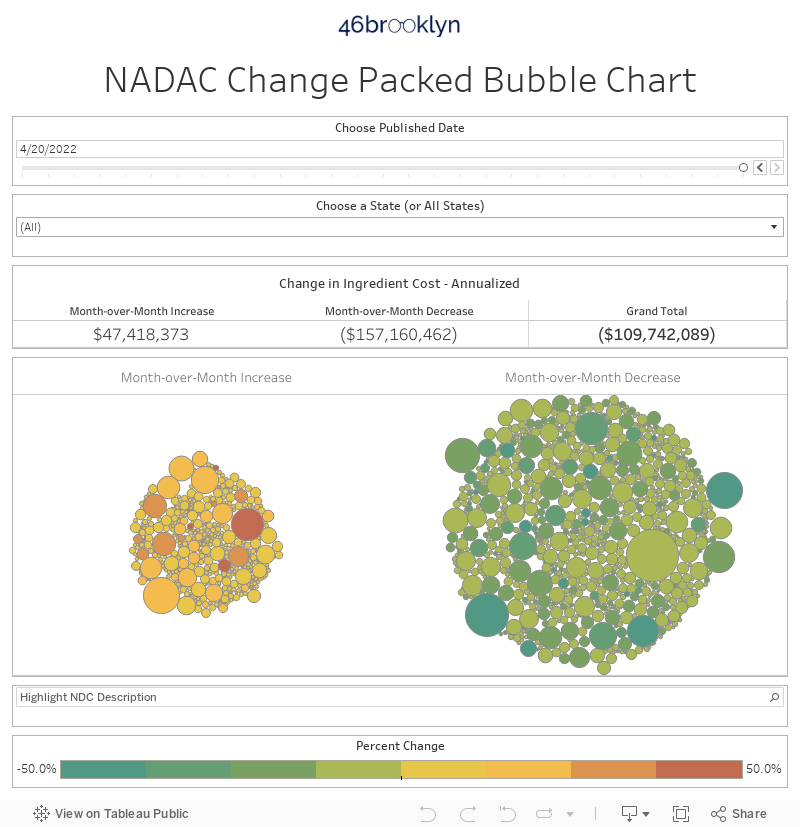
There was a lot of movement on drug prices this month, so be sure to click through our new updated visualizations (NADAC Change Packed Bubble Chart and Drug Pricing Dashboard) to see the impact.
As a reminder, each month retail pharmacies across the country are surveyed by Myers Stauffer (on behalf of the Centers for Medicare and Medicaid Services) on their wholesaler invoice prices. The results are then compiled and released either the third or fourth week of the following month. On April 17th, survey results were released that reflect National Average Drug Acquisition Cost (NADAC) price changes from March. Here are our top takeaways on the results:
1. Kudos, generic manufacturers! You did your job this month.
Each month, we first look at how many generic drugs went up and down in the latest month’s survey of retail pharmacy acquisition costs, and compare that to the prior month. As shown in Figure 1, there were a lot fewer drugs that increased in price this month when compared to last month, and a lot more drugs that decreased in price.
Figure 1
Source: Data.Medicaid.gov, 46brooklyn Research
To put some numbers to this, for every generic drug that experienced a price decline this month, there were only 0.62 generic drugs that experienced a price increase. That’s way down from a ratio of 1.05 last month.
Also, in April, there were 19% more generic drugs that experienced a 0-10% price decrease, and 54% more generic drugs that experienced a price decrease of more than 10%. Conversely, there were 26% fewer drugs that experienced a 0-10% price increase, and 25% fewer drugs that experienced a price increase of more than 10%.
2. This month brought $107 million of annualized deflation using Medicaid’s drug mix
As we’ve written in prior updates, knowing the price change alone is not enough. We need to apply utilization (drug mix) to the price changes, which is the purpose of the NADAC Change Packed Bubble Chart. We use Medicaid’s first three quarters of 2018 drug mix and annualize it to arrive at an estimate of the total dollar impact of the latest NADAC pricing update. The green bubbles on the right are the generic drugs that experienced a price decline in the latest survey, while the yellow/orange/red bubbles on the left are those drugs that experienced a price increase. The size of each bubble represents the annualized weighted impact of the drug on Medicaid – i.e. we multiply the survey price change by aggregate drug utilization in Medicaid. Add up all the bubbles and we get the total annualized deflation. This month, it was an impressive $107 million.
3. Prices for generic Anafranil erode
This month brought about some meaningful deflation on generic Anafranil (Clomipramine 25 mg, 50 mg, and 75 mg Capsules). An important antidepressant for the treatment of obsessive-compulsive disorder (OCD), Clomipramine price drops are certainly welcome, considering that it is still recovering from a 650% increase that occurred from June 2013 to June 2014. Despite the recent price drops, the medication is still pretty expensive for a generic that has been on the market for decades. Figure 2 shows the pricing movement since 2014.
Figure 2
Source: Data.Medicaid.gov, 46brooklyn Research
Overall, this month’s price drops of the three different strengths (highlighted in Figure 3) resulted in $1.3 million in annualized savings to state Medicaid programs, with a lion’s share coming from Clomipramine 75 mg Capsules, which declined by 43.2%.
Figure 3
Source: Data.Medicaid.gov, 46brooklyn Research
4. Generic Verelan PM prices have absolutely skyrocketed
One of the benefits (or curses) of our tools is that you can use the anomalies and distortions to chase down drug pricing mysteries.
The first thing we noticed as we loaded up our NADAC Change Packed Bubble Chart was a massive jump in the three strengths of generic Verelan PM (Verapamil ER PM 100 mg, 200 mg, and 300 mg Capsules). The three different strengths increased by 304.8%, 339.1%, and 271.3% respectively. The chart below (Figure 4) highlights the massive spikes.
Figure 4
Source: Data.Medicaid.gov, 46brooklyn Research
Initially, these jumps appeared to have come out of nowhere. But of course, we know that nothing actually comes out of nowhere, so we dug further.
Here’s the Cliff notes version of what happened with this drug.
Verapamil ER PM has only ever had two manufacturers – Kremers Urban Pharmaceuticals and Mylan Pharmaceuticals. Kremers markets both brand name Verelan PM and the generic Verapamil ER PM. Their generic is an “authorized generic,” which effectively is just the brand drug with a generic label. How do we know? Both of Kremers’ National Drug Codes (NDCs) have the same application number in the FDA’s databases – NDA020493. Also, both the brand and the generic have the same market introduction date back in 1998. Any way you look at it, it’s the same drug.
Mylan on the other hand has a different application number – ANDA078306. This is an “abbreviated” new drug application, which is the tell-tale sign of a true generic drug. Mylan brought this generic Verapamil ER PM to market in August 2007.
Anyway, with only two competitors the price of this drug did what you would expect – as shown above in Figure 4, not much of anything – until just recently.
So what happened? We found some clues in our Medicaid Market Share Dashboard. When we selected Verapamil ER PM, Kremers had the overwhelming majority of market share in Medicaid in Q3 2018 for the 100 mg strength, and 100% market share for the 200 mg and 300 mg strength. Click on the arrows to the right and left of the slide show shown below to flip between strengths.


So what happened to Mylan? We called around to some pharmacies and asked if they could purchase Mylan’s Verapamil ER PM. No dice. Wholesalers are reporting that this drug was “discontinued by supplier.” We dug further in the bowels of the FDA NDC database and sure enough, Mylan’s NDCs for all strengths have an “end marketing date,” indicating that Mylan has pulled, or is planning on pulling the NDC. What’s perplexing is that the end marketing date is listed as 11/30/2019 (Figure 5), which is months from now! Yet pharmacies can’t buy it today. 🤷♂️
Figure 5
Source: FDA.gov
The big question is, when did Mylan actually pull this drug from the market? Because we know what Kremers did – last September, Kremers jacked up the Average Wholesale Price (AWP) and Wholesale Acquisition Cost (WAC) on all strengths by 185%, bringing the list price of its authorized generic more inline with the list price of its brand version. Did Mylan truly drop out of the market before Kremers’ price increase? While that would increase the drama of this story, it doesn’t change the end result. Folks, this appears to be a rare case of a mature, multi-source generic drug effectively reverting back to a brand drug. And we thought we’d seen it all…
While the Kremers price hike occurred back in September, as you can see, it isn’t until now that the hike is being reflected in the NADAC database. This is because NADAC is a compilation of pharmacy invoice costs to acquire their medications. Once a pharmacy or wholesaler acquires a drug, it takes time for them to deplete the inventory of that drug, especially for a drug with relatively low utilization trends. So we think that explains why it took several months for the NADAC survey to pick up the price change on this drug. But it eventually did, and we are immensely grateful for that, because without this public database we would have no visibility into this massive price spike. Thank you, CMS.
5. Generic Symmetrel prices ticked up
Another drug that bumped up in price was generic Symmetrel (Amantadine 100 mg Tablet and Capsule forms). This decades-old antiviral medication has been deflating in price slowly over the last five years, but the tablet version has been experiencing some pricing volatility in recent months (Figure 6).
Figure 6
Source: Data.Medicaid.gov, 46brooklyn Research
While the pricing movement is worth keeping an eye on, perhaps even more interestingly, you can see that historically, the tablet version has always been more expensive than the capsule form. In fact, through most of 2018, the capsule version was essentially less than half the cost of the tablet form.
If you were to reproduce the above chart on our Drug Pricing (NADAC) Dashboard, just hover over each line to see the reason why – there is simply more competition in the capsule form (nine different manufacturer applications) than the tablet form (five different manufacturer applications). If there is one thing we have learned about NADAC, it’s that it tends to adhere to the fundamental principles of supply and demand fairly well.
To be clear, there may be some legitimate clinical reasons to prefer one form over the other. We’re not qualified to opine on that – this is the role of the pharmacy benefit manager (PBM). But this is the sort of discussion we need to broadly have to ensure that formularies are being set in a manner that is optimizing the cost/benefit for the payer. We need some quantification on how much additional benefit the tablet brings, and is it enough to justify the additional cost?
Interestingly, the data shows that states have very different opinions on the relative value of the different dosage forms of this drug. We examined CMS State Utilization Data to see how state Medicaid programs were doing at discouraging utilization of the more expensive forms.
Figure 7 shows all state/program combinations that have dispensed more than 1,000 prescriptions of Amantadine 100 mg in 2018 (Q1-Q3). According to the data, the California Medicaid fee-for-service program (#2 on the list) sees almost no reason to buy the more expensive tablet – 98% of all Amantadine 100 mg prescriptions were dispensed in the cheaper capsule form. On the other hand, Texas managed care (#1 on the list) is loving them some Amantadine tablets, with 46% of all prescriptions heading out of the pharmacy door in tablet form. Once again, another indication that everything is bigger in Texas.

Figure 7
Source: Data.Medicaid.gov, 46brooklyn Research
Truth be told, this isn’t an enormous amount of waste we are talking about here. We estimate that the tablet costs about $30-$45 per prescription more than the capsule. So, if Amantadine tablets were completely eliminated from Medicaid, we are talking about anywhere between $640k and $970k over nine months.
But the absolute cost savings is not the point of this extended tangent on Amantadine. The point is that we should not see this sort of variation from state to state. The cost/benefit tradeoff between dosage forms should be known, or at least relatively understood in the marketplace. The supply chain simply has to figure out a way to quantify the relative benefit of drugs that are arguably therapeutically equivalent, and then use math to set and manage formularies to optimize cost/benefit for its clients.
Easier said than done, but people in this supply chain get paid a lot of money to figure these things out. But just in case this doesn’t happen, we’ll stick around and keep picking rotten cherries off of this cherry tree.
6. Generic Glumetza – another formulary management issue?
In this month’s update, a familiar name popped up again: Generic Glumetza (Metformin ER 1,000 mg Gastr-TB). This last survey saw it increase by more than $2.40 per tablet, amounting to a 15.9% increase in its NADAC price.
While this was a certainly notable spike, as we began looking into the drug, we noticed that there were some really fascinating historical pricing movements and once again, potentially another rotten cherry that was begging to be plucked off the tree and studied.
For students of drug pricing, brand-name Glumetza should be very familiar. It was one of the drugs targeted by the much-maligned Valeant Pharmaceuticals for its purchase-and-spike practices.
For those struggling with Type 2 diabetes, prescription drug affordability is a big deal, and the initial release of generic Glumetza was highly anticipated by those footing the bill for it.
Unfortunately, the generic market disappointed here. As shown In Figure 8, generic Glumetza is crazy expensive, even if you are buying direct from a wholesaler. If you are Medicaid managed care it’s even worse - generic Glumetza ran Medicaid managed care nearly $60 a tablet in Q3 2018.
Figure 8
Source: Data.Medicaid.gov, 46brooklyn Research
Note: Over the period shown on this chart the “NDC Description” for the collection of generic Glumetza NDCs was changed in the NADAC database from “Metformin HCL ER 1,000 MG Tab” to “Metformin ER 1,000 MG Gastr-TB,” so we had to combine the two to create this trend chart.
Of course, our next logical question is the same as we had with generic Symmetrel – what’s the cost/benefit of this drug relative to prior generation versions of what are (arguably) very similar drugs? Again, we can’t quantify relative benefit, but we can quantify relative cost, which we have done for you in Figure 9.
Figure 9
Source: Data.Medicaid.gov, FDA.gov, 46brooklyn Research
A few takeaways from the above table:
Plain old Metformin is dirt cheap.
The second generation of Metformin (generic Fortamet) is 163 times the cost of the original. States are paying more than $5 per tablet above cost for this drug, making it a very high markup drug.
The latest generation of Metformin (generic Glumetza) is 709 times the cost of the original. Managed care collectively paid a nosebleed $37.68 per tablet premium for this drug in Q3 2018, making it one of the highest markup generic drugs out there (this is generic Gleevec territory).
We find it interesting that the majority of the digging we’ve done in this report has all led to the same concern about formulary management. Why do pricing games that start with the manufacturer appear to be festering within this system, rather than getting snuffed out by the PBM? Not like we are letting pharma off the hook for these actions, but isn’t it fundamentally the PBM’s job to prevent this from happening? To be sure, these are only a few examples, but they are quite disconcerting to us. We now realize that we need to spend more time analyzing utilization of therapeutic equivalents to see how widespread this problem really is.
What are you seeing?
While we spend more time than we’d like to admit studying the pricing changes during each NADAC Survey Results Week, we don’t always catch every story worth noting. Be sure to take a gander at all of our updated Visualizations that rely on NADAC prices. If you’re seeing any interesting movement on drugs in the dataset, let us know.
Making an impact
This past week, we were extremely busy after the release of our report on spread pricing and pharmacy margins in Ohio, which was the most read report we’ve ever created, by a mile. Thanks to everyone who read it and shared it. We know it was a bear of a report to get through, but we felt that every bit of it needed to be there.
We’d like to thank Darrel Rowland at the Columbus Dispatch and Bob Herman at Axios for highlighting some of the finer points of the report. We’d also like to thank the Pharmaceutical Care Management Association for making our year. 👉
The report caused quite a stir in Ohio, where PBMs were already under intense scrutiny for their $224.8 million haul from spread pricing. Our report’s findings on specialty drugs seemed to ruffle some feathers, and yesterday, the Ohio Department of Medicaid already started calling for reforms in the specialty pharmacy space. Apparently, they felt those rotten cherries might be spoiling the pie.
Lastly, be sure to check out 46brooklyn’s Eric Pachman in Health Affairs today, as he joined Ge Bai, Mike Sharp, and Mariana Socal in discussing the inefficiencies in Medicaid managed care contracting for generic drug coverage, as well as ways to possibly yield better results for taxpayers.