
All aboard the summer drug pricing roller coaster
The CLIFF NOTES
As a non-profit, we at 46brooklyn have made it our goal to provide insights into U.S. drug pricing data available in the public domain based on the figures we’re able to gather and evaluate. Today’s report covers the drug pricing activity over the month of June 2024, with insights coming principally from our updated Brand Drug List Price Change Box Score, NADAC Drug Pricing Dashboard, and NADAC Change Packed Bubble Chart. We’re running a little behind at 46brooklyn with all of our other reports; so we’re going to attempt to speed-run the June update so that we can hopefully get back on track with July (when brand price increases generally make their second showing). As summer is coming to an end for those of us living in real-time, let’s see what heat drug pricing cooked up at the start of summer.
As it relates to brand drug list prices in June 2024, there were 34 increases in June and four decreases (so, 30 in the net), with price changes ranging from a 55.7% decrease to a 17.9% price increase.
The biggest movers to take note of for June 2024 were:
· Cardene IV Solution (55.7% decrease; $234k Prior Year gross Medicaid Expenditures [PYME])
· Sensorcaine-MPF Solution (17.9% increase; $1.4 million PYME)
· Otezla Oral Tablet (6.0% increase; $317 million PYME)
· Tagrisso Oral Tablet (3% increase; $163 million PYME)
· Lynparza Oral Tablet (3% increase; $131 million PYME)
Bear in mind that as you read those numbers, that they are the prices before drugmaker rebates (which have hit more than $330 BILLION per the latest Drug Channels numbers), which as we know are growing significantly over time and are at their largest amounts in the Medicaid and 340B programs.
On the generic side of the coin, year-over-year (YoY) generic oral solid price deflation (as quantified by NADAC) showed that relative to where we were a year ago generic drug prices have come down 10%; however, when we looked at how generic drug prices from May to June the results were not as favorable (with generic costs inflating). As we discussed last month, volatility in NADAC is a feature not a flaw of a benchmark that seeks to quantify what is going on with drug pricing (a benchmark price that never changes when the market does is not a representative benchmark of drug pricing). Said differently, some May-to-June heat on generic drug price increases would still appear ‘worth it’ if we take a longer view with our perspectives on drug pricing (i.e., the YoY decline).
What we saw from brand-name medications in June
1. A small number of brand drug list price changes
There were a total of 34 brand-name medications that saw wholesale acquisition cost (WAC) price increases in June and four list price decreases, for a net of 30 total price increases, which is all featured and contextualized in our Brand Drug List Price Change Box Score.
List price changes ranged from -55.7% to +17.9% and impacted approximately $1.2 billion in prior year gross Medicaid expenditures (PYME). Recall that we use PYME as a rough measure of the drug’s significance to the U.S. market. Medicaid being one of the largest payers nationally means that the amount of money Medicaid pays for a medication is a rough signal of its overall value to us collectively. This June’s PYME is the roughly 10-times greater than what we saw in May (which, to be fair, was the smallest PYME month thus far), so the brand name medications taking price changes are a little more impactful this month.
About a third of the PYME value for this month comes for the list price changes on Otezla, which took a 6% increase. Otezla had over $317 million PYME (out of that $1.2 billion).
2. Brand price trends over time
To help contextualize brand-name drug list price increase behavior, we find it beneficial to review past trends. In comparison to the data from prior months of June, this year seems to be a little higher than usual. The highest number of June changes occurred in June 2016 with 173 net brand list price increases whereas the lowest was in June of 2021 when there were only nine net price increases. To put it into a more recent perspective, there were a net (combined increases and decreases) of 45 in June 2023, 15 in June 2022, 9 in June 2021, and 16 in June 2020.

Figure 1
Source: Elsevier Gold Standard Drug Database, CMS State Drug Utilization Data, 46brooklyn Research
Moreover, when further examining our brand drug box score visualization, of the drugs that took increases so far this year, the median price increase has been 4.9% – a percentage that has been holding steady without much fluctuation since 2019. On a weighted basis, there hasn’t been much movement with the calculated value based upon Medicaid utilization for drugs that have taken a price increase holding at 0.8% (as shown in Figure 1).
As we have been saying pretty consistently over the last couple of months, this is a signal that the individual drugs that saw price changes in June are not that impactful (not affecting the yearly average impact of price changes) relative to the drug price changes that have already occurred throughout the year (which were basically all driven by the January price changes). We are getting on the cusp of where a few more Otezla-like products taking price increases (as is likely to happen in July), and we will probably see a little movement on Stat Box #4.
3. Brand drug list price changes worth taking note of in May
While we have thus far focused on the aggregate brand picture, next we identify specific brand drugs worth taking note of in a couple different ways. Primarily, we look for medications with a lot of prior year gross Medicaid expenditures (PYME). We next look for drugs with large pricing changes (+/- 10%). And finally, we look for drugs that are interesting for us either because we’ve previously written on them, they’ve recently been in the news, or because we find them of unique clinical value. This month, when looking for these drugs in the brand arena, we found several worth mentioning based upon these reasons:
Blood Pressure
Cardene IV (nicardipine) is indicated for the short-term treatment of hypertension when oral therapy is not feasible or not desirable. This is because it is an IV medication, and we have lots of awesome oral medications (which are generally cheap generics) to control blood pressure in the long-term. This medication took a 55.7% decrease, which impacted just $234k of PYME (and was the biggest decrease for the month). As an IV drug, patients are not going to self-administer; rather this drug is going to be given at a hospital or clinic or some sort of medical facility. Which made us interested in seeing if we could find some of the hospital pricing for this drug, given that we may be under-estimating its expenditures relying upon Medicaid State Drug Utilization Data (since most of the spend is likely through medical billing, not pharmacy). Cardene IV is going to be generally billed individually under J2404 - Inj, nicardipine 0.1 mg. In our central Ohio area, there are three big hospital systems – OhioHealth, Mount Carmel, and Ohio State University. Looking up the machine-readable files for these organizations is a pain in the neck, but we found one amongst the largest hospitals that had a published price for J2404 (the rest were using an alternative nicardipine product). Although this is the pricing for just one hospital the learnings are still interesting. OhioHealth’s Riverside Methodist Hospital in Columbus has a price range for this product from $46.80 to $213.80. (Figure 2). Note that the machine readable files don’t really say when they were last updated, so the date we list is the date we accessed the data.

Figure 2
Source: OhioHealth Riverside Methodist Hospital price list
Unsurprisingly, when there is an approximate five-times difference from low to high, these reported prices range from approximately half the manufacturer’s list price (based upon the June 2024 price) to double the manufacturer list price. This is despite the same medication being used, at the same hospital, and with the same staff (i.e., yet another way we see evidence of more than the manufacturer list price influencing pricing). Whether Riverside priced this product in reflection of the June price decrease is hard to say as it is not always clear when these files were last updated and/or published.
While we stumbled upon this medication because of simply identifying the product with the biggest price decrease in June 2024 and attempted to figure out what more we could learn about its pricing (i.e., a potential ‘cherry-picked’ example), we note that there are 81 different health plans listed in the hospital price list with 17 unique prices. Some of the variability in price is likely a result of the sheer number of plans being dealt with (i.e., we suspect that if there were fewer plans, we’d see smaller ranges). However, we can see that even within the same health plan “parent organization,” there are price differences (so the sheer number of plans alone cannot explain why were are seeing such pricing variability). For example, there are 18 Aetna plans listed overall, but still three different unique prices across just those 18 plans (i.e., if Aetna had fewer plans we really can’t say if it would have fewer than three prices). In Figure 3 below we show just the plans that have the same parent organization (based upon the listed health plan name) but multiple unique pricing experiences for the same drug.

Figure 3
Source: OhioHealth Riverside Methodist Hospital price list
In digging deeper, we can make a number of further observations. First, there are health planparent organizations that have many listed plans with just one set of prices (CareSource is an example of parent organization that has two plan offerings with the same price). We interpret this to mean that it is possible to value the service the same across different lines of business for the insurer at the same hospital, but some are not – which is interesting.
Next, we can see from the Riverside Methodist file that the listed gross charge is $213.80, which means that every plan with a price at $213.80 is not only paying the gross charge (i.e., undiscounted), but also paying more than the listed cash discount ($138.97) also from Riverside Methodist within the file. There are 20 out of 81 plans that have a price for the product listed at $213.80. And for what it’s worth, it appears that Medicaid and Medicare plans (i.e., government plans) seem to have exposure to the highest price ($213.80) the majority of the time.
So despite health systems saying that government programs like Medicaid and Medicare are the worst payers, the data – at least for this one drug – doesn’t seem to support that. All Medicaid managed care organizations (MCOs) reported in this price list have charges at $213.80, as do basically every listed Medicare plan (though it’s not always 100% clear which are Medicare plans based upon plan name, so we may have missed some).
Interestingly, we can also see some really interesting disparities within the same big insurers. One of the health plans listed is named “Anthem Federal Government.” Assuming that health plan is for federal employees, they’re one of the plans getting the lowest price for this medication – $46.08. However, the Anthem Medicare plans are getting charged the highest – $213.80 (i.e., the Anthem MediBlue plans listed within the price list). So does this mean that the Senators and Representatives who are overseeing the Medicare program are getting experiences that are highly differentiated from the constituents they represent? We ask the question because we’re generally not sure how to interpret these results. Thoughts? Let us know.
On the other end of the spectrum, only 28 out of 81 plans are getting a price below the listed cash discount of $138.97. What’s more is that this hospital is an OhioHealth Hospital and the listed price for “Ohio Health Choice Plan” is actually higher than the listed cash discount (at a price of $175.32). Does this mean the health benefits of the hospital’s own employees are not as generous as those extended to cash-paying customers of the hospital? The data would seem to suggest that at least in one instance, yes.
We’re just dipping our toes into these hospital chargemasters, but it is interesting to see so many plans with so many different prices on one drug with one set of manufacturer list prices. More to come on this front in the future…
Anesthetic
Sensorcaine MPF (bupivacaine) is indicated for the production of local or regional anesthesia or analgesia for surgery (17.9% increase; $1.4 million PYME). Some bupivacaine products are currently in shortage and so the pricing activity may represent simple economics (increase demand = increase price), but we know hardly anything in drug pricing is ever as simple as it seems. For example, while we have this listed as a brand product (based upon the methods employed by our dashboard), many may consider Sensorcaine MPF a generic despite it having a trade name, which makes us wonder if this is paying Medicaid brand-like rebates or generic rebates. Hmmm…
Disease Modifying Anti-Rheumatic Drug (DMARD)
Otezla (apremilast) oral tablets are used to treat certain kinds of arthritis (6.0% increase; $317 million PYME). Otezla was originally brought to market by Bristol Myers Squibb (BMS); however, they sold it to Amgen as part of the BMS-Celgene merger. The sale seems to have worked out for Amgen who has, at least according to analysts, been able to position its oral therapy well against injectable alternatives.
Oncology
Tagrisso (osimertinib) oral tablets are used to treat certain types of lung cancer (3% increase; $163 million PYME). The product has garnered some notable wins for the manufacturer of late – getting approved in Canada and China, as well as having some positive clinical trial results.
Lynparza (olaparib) oral tablets are used for the treatment of certain kinds of ovarian cancers (3% increase; $131 million PYME). Within its class, the medication appears to be well positioned to continue to play a dominant role in treating the cancers it targets, at least according to analysts within the space.
Bear in mind that as you read these brand drug numbers, they are the prices before drug maker rebates are accounted for, which as we stated prior are growing significantly over time and are at their largest amounts in the Medicaid and 340B programs. While these list prices are bloated and intended to be negotiated, for those who are underinsured, uninsured, or in high-deductible health plans, these “fake” list prices become very real.
Of course, our update doesn’t end with brand medications. While brand drugs represent the majority of payer costs, patients overwhelmingly take generic medications, which means we cannot overlook what is going on with them.
What we saw from generic medications in June
4. An unfavorable, unweighted price change picture
Each month, we start our evaluation of generic drug price changes by looking at how many generic drugs went up and down in the latest month’s survey of retail pharmacy acquisition costs (based on National Average Drug Acquisition Cost, NADAC), and compare that to the prior month. Basically, the quick way to read Figure 4 below is to look for orange bars that are taller than blue bars to the left of the line, and exactly the opposite to the right of the line. That would indicate a good month – more generic drugs going down in price compared to the prior month, and less drug prices going up.
Figure 4
Source: Data.Medicaid.gov, 46brooklyn Research
As can be seen in Figure 4, many more drugs increased in cost this month compared to the prior month. Collectively there were about six NADAC price increases for every one decrease in June 2024. So while not the best of early signals, we take this unweighted price change analysis with a grain of salt. If a bunch of under-utilized drugs took price increases, then the overall effect can be minimal (except to those potentially taking the drug). To really make heads or tails of all of these pricing changes, we need to add a weight to these changes.
5. Weighted Medicaid generic drug costs come in at $404 million inflation
While you can track each individual drug’s NADAC over time at our NADAC Drug Pricing Dashboard, the purpose of our NADAC Change Packed Bubble Chart is to apply utilization (drug mix) to each month’s NADAC price changes to better assess the impact. CMS just published Q4 2023, so we’ve moved to just 2023’s drug mix from CMS to arrive at an estimate of the total dollar impact of the latest NADAC pricing update. As a reminder, we’re choosing the last full-year picture available in order to remove variances in drug mix from this equation (and focus just on the role that NADAC price changes have over time). This helps quantify what should be the real effect of those price changes above from a payer’s perspective (in our case Medicaid; individual results will vary). Said differently, if a drug that is hardly ever utilized takes a 50% decrease, it doesn’t matter as much if a drug everyone takes increases by 5% (the inverse of this is what we observed at the start of the year with the brand name insulin price decreases [see our January 2024 report]).
The green bubbles on the right of the Bubble Chart viz (screenshot below in Figure 5) are the generic drugs that experienced a price decline (i.e. got cheaper) in the latest NADAC survey, while the yellow/orange/red bubbles on the left are those drugs that experienced a price increase. The size of each bubble represents the dollar impact of the drug on state Medicaid programs, based on their utilization of the drugs in the most recent trailing 12-month period (i.e. bigger bubbles represent more spending). Stated differently, we simply multiply the latest survey price changes by aggregate drug utilization in Medicaid over the past full year, add up all the bubbles, and get the total inflation/deflation impact of the survey changes.

Figure 5
Source: Data.Medicaid.gov, 46brooklyn Research
Overall, in June, there was just over $442 million worth of inflationary drugs, but that was hardly offset by just over $37 million of deflationary generic drugs, netting out to approximately $404 million of generic drug cost inflation for Medicaid. While certainly a big number, bear in mind that April deflation was over $480 million and May deflation was over $80 million (both of those numbers have been revised up with the shift from relying upon Q4 2022 to Q3 2023 to now fully relying upon 2023 utilization; i.e., if you look at the May and April reports the amounts reported will be smaller than we’re reporting here). So while $400+ inflation is certainly a lot, we’re still over $100 million in deflation over these past three months which we shouldn’t lose sight of.
And while month-over-month changes are interesting, they inevitably lead to questions about how year-over-year (YoY) is trending, which leads us to our next analysis.
6. Year-over-year generic oral solid deflation down to 12.7%
Ever since June 2020, we have been tracking year-over-year (YoY) deflation for all generic drugs that have a NADAC price. We once again weight all price changes using Medicaid’s drug utilization data. The last few months, NADAC deflation has been on a tear, 20%+ deflation for April and May (see our prior reports). If you are a purchaser of generic drugs (based on the actual costs of drugs; not AWP), an increase in this metric is ideal, as it means costs are declining. Businesses generally enjoy it when their input costs go down. While the amount of deflation has been this month is less than the past two months, this month’s 12.7% oral deflation is almost perfectly equal to the average NADAC oral deflation overall in our chart (which is 12.5%) (Figure 6). Said differently, the orange dot in June is almost perfectly equal to the dashed blue line in the figure below. Note, we’ve received some comments that our chart may make more sense if we show the values as negative (to match the idea of deflation), so this chart looks a little inverted relative to past months (hopefully that is not too confusing of a change). Whereas before more deflation was a higher value (i.e., towards the top of the chart), in this view, more deflation will be shown by values closer to the bottom of the chart.
Figure 6
Source: Data.Medicaid.gov, 46brooklyn Research
So while this month was more inflationary than deflationary month-over-month, we’re still very much down on drug prices (as measured by NADAC) compared to where we were a year ago. Which brings us nearly to the end of our monthly report.
At the end of each monthly report we like to review the individual generic drugs worth noting (in a manner similar to what we did with brands). We generally identify these drugs based upon the size of the bubbles in our packed bubble chart; however, with the decreases we’ve been observing in NADAC over the last few months, we’ve not been doing that. So to try to get us back on track, and because NADAC from May to June was kind of an anomaly, we thought it would be best to go back to our last individual drug call outs (in March 2024) to show that while NADAC can be a rollercoaster of a ride as of late, the end result is nearly always a decline in price.
7. Top/notable generic drug decreases
Back in March 2024 (the last time we called out individual generic drugs rather than talk about NADAC more generally), we highlighted amiodarone 400 mg, guanfacine 1 mg, and the expensive form of extended release metformin (gastric tablet) 1,000 mg as the most notable decreases that month (in terms of NADAC). So if those drugs had already decreased from February to March to a noteworthy degree, what happened to them over the last few months as NADAC has been on a tear of price decreases? Well, all of them are even cheaper now then they were back then. As can be seen below (Figure 7), they’ve gone down along with most of the other generic drugs (even after having been previously highlighted that they were decreasing in March):
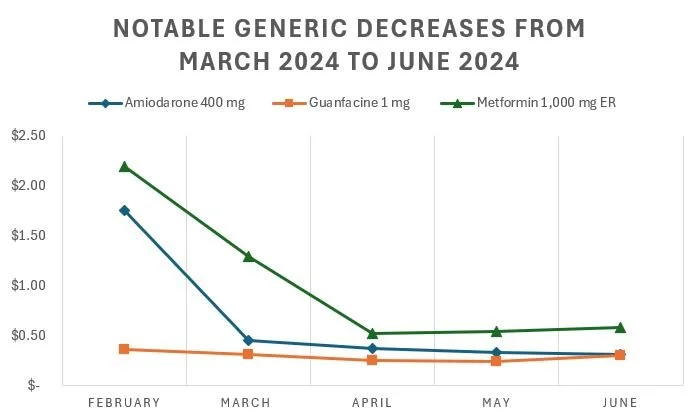
Figure 7
Source: Data.Medicaid.gov, 46brooklyn Research
Perhaps the above isn’t as surprising giving the downward decline in NADAC, so let’s look at what has happened with those generic drugs we had previously identified as potential concern (given their NADAC price increases).
8. Top/notable generic drug increases
Also back in March 2024, we identified desipramine 25 mg and dexmethylphenidate ER 10 mg as the generic drugs worth noting due to their NADAC price increases. Interestingly, but not surprising, we also discussed dexmethylphenidate ER 10 mg in our report last month (we just can’t get away from talking about ADHD medications in these updates). As we did above, below we identified the price trends for these medications as NADAC has been a deflationary shredder as of late (Figure 8).

Figure 8
Source: Data.Medicaid.gov, 46brooklyn Research
We recognize from a certain perspective, looking at historic prices of generic drugs relative to their old price will always show decreases (because if we go back far enough they would have been brand name medications). However, hopefully in revisiting some of the past drugs we’ve reviewed, we can appreciate that NADAC volatility month-to-month may not be the best way to appreciate what NADAC is/does/represents to the market over time.
For all you podcast buffs, 46brooklyn CEO Antonio Ciaccia joined the Business of Pharmacy Podcast and the RealPharma Podcast for long-form discussions on the state of PBM reforms.
Also, check out Ciaccia’s interview with Mike Elliott at WTVN Columbus on the latest federal happenings on PBMs as well.
Kudos to Sara Sirota at the Capitol Forum for snooping around our monthly drug pricing reports to dig in on some of the recent price increases from Harrow, the manufacturer of several ocular therapies.
It was great to see our work cited in last month's PBM report released by the U.S. House of Representatives Committee on Oversight and Accountability. The hearing was pretty cool too.
Lastly, big shout out to drug supply chain reporting legend Marty Schladen at the Ohio Capital Journal for this great write-up on our recent report on Medicare Part D drug pricing disparities.