
May the drug pricing deflation be with you
The CLIFF NOTES
As a non-profit, we at 46brooklyn have made it our goal to provide insights into U.S. drug pricing data available in the public domain based on the figures we’re able to gather and evaluate over the course of the year. Today’s report covers the drug pricing activity over the month of May 2024, with insights coming from our updated Brand Drug List Price Change Box Score, NADAC Drug Pricing Dashboard, and NADAC Change Packed Bubble Chart.
While the summer heat is fully upon on us now, this month’s drug pricing report looks back at the latest action from the month of May, which just so happens to represent the last full month of spring. Which means we can say that, as of this spring, active drug shortages have reached an all-time high of 323 medications in the first quarter alone. You’ll notice we’re a little late getting this report out. We apologize for that. Our team has been busy and needed a little break. And before you think it’s just us Star Wars dorks being too wrapped up in The Acolyte, you’re wrong; we bailed after episode 3 (come on Disney, do better).
There were 74 revisions to ASHP’s drug shortage list in addition to four new shortages that were created in May. Some notable and newsworthy recent medication shortages have included the popular type 2 diabetes medications, Ozempic and Mounjaro, as well as the weight loss medications Wegovy and Zepbound.
A drug shortage can affect the price of a medication for patients in a few different ways – sometimes in ways that don’t seem rational. Consider that Ozempic hasn’t taken a wholesale acquisition cost (WAC) list price increase since January 1st, 2024 and yet in May, the national average drug acquisition cost (NADAC) price for Ozempic creeped up ~$2 per package. This is arguably a rounding error for a product with a $1,000 WAC, but it is demonstrative of how NADAC prices are not manufacturer list prices (with all the implications that implies – more on that later). However, we’ll leave most of the commentary on weight loss medications to others, and instead focus on what we normally do with these reports, by diving into the WAC and NADAC price changes for brand and generic drugs respectively.
As it relates to brand drug list prices in May 2024, there were 13 brand drug list price increases in May and three decreases (so, 10 in the net), with price changes ranging from a 64% decrease (i.e., cutting the price in half) to a 99% price increase (i.e., doubling the price).
The biggest movers to take note of for May 2024 were:
· Natacyn ophthalmic drops (99.9% increase; $76k Prior Year gross Medicaid Expenditures [PYME])
· Nitro Bid topical ointment (9.9% increase; $850k PYME)
· Daybue oral solution (9.4% increase; $32 million PYME)
· Cleocin vaginal cream (64% decrease; 186k PYME)
· Zyvox powder for oral suspension (64% decrease; N/A PYME)
· Spinraza solution for injection (3% increase; $63 million PYME)
· Valchlor topical gel (4% increase; $2.3 million PYME)
The two of the three brand medications that experienced a price decrease are for antibiotics and from the same pharmaceutical manufacturer, Pfizer. Cleocin vaginal cream is a topical antibiotic used for the treatment of BV in females, whereas Zyvox is an oral antibiotic used to treat enterococcal infections, pneumonia, and skin infections.
Some standout price increases are for medical conditions, including ocular fungal infections (Natacyn), chest pain (Nitro Bid), for a rare genetic diseases (Spinraza, Daybue), and a rare type of skin cancer (Valchlor).
Although the percentage increase wasn’t high, the actual dollar amount was for two medications — Spinraza solution for injection and Valchlor topical gel, are likely to be a significant cost increase to payers if drugmaker rebates are not increasing to the degree necessary to offset the list price increases. These medications already cost a pretty penny (see PYME numbers above), so even a small increase of under 5% can really stand out. For example, when launched, Spinraza cost $125,000 per injection. While it has taken several price increases over the course of time since its launch, a 3% increase off that initial amount is $3,750 per injection alone (more now with the historic price increases).
Bear in mind that as you read those numbers, that they are the prices before drug maker rebates (which have hit more than $330 BILLION per the latest Drug Channels numbers), which as we know are growing significantly over time and are at their largest amounts in the Medicaid and 340B programs .
On the generic side of the coin, year-over-year (YoY) generic oral solid price deflation (as quantified by NADAC) stayed elevated (like observed in April), up to 25.1% for May. Several of the generic ADHD stimulants are showing notable increases, including methylphenidate ER products, dexmethylphenidate ER products, and dextroamphetamine-amphetamine products, which may be related to ADHD medication shortages – though we have long observed volatility in ADHD NADAC prices. But before you think the sky is falling with generic drug NADAC pricing, we will remind you that NADAC, and NADAC alone, is often not enough to fully contextualize generic drug prices (less you forget every point we’ve made in all our prior reports).
So although school’s out for summer, not a day goes by that us here at 46brooklyn aren’t learning something new about drug pricing and of course passing that knowledge (whether you asked for it or not) down to you! Which means, just like in class, you’re free to check out after this summary or actually stick around and maybe learn something you didn’t know before you opened this report.

What we saw from brand-name medications in May
1. A small number of brand drug list price changes
There were a total of 13 brand-name medications that saw wholesale acquisition cost (WAC) price increases in May and three list price decreases, for a net of 10 total price increasees, which is all featured and contextualized in our Brand Drug List Price Change Box Score.
List price changes ranged from -63.8% to +28% and impacted approximately $103 million in prior year gross Medicaid expenditures (PYME). Recall that we use PYME as a rough measure of the drug’s significance to the U.S. market (Medicaid being one of the largest payers nationally means that the amount of money Medicaid pays for a medication is a rough signal of its overall value to us collectively. This May is the lowest PYME number we’ve observed thus far in 2024, so don’t be surprised when we say these price changes are unlikely to be that impactful to overall drug spending (unless one of these is a medication you take).
Over half of the PYME value for this month comes for the list pricing changes on Spinraza, which took a 3% increase. Spinraza had over $63 million PYME (roughly 61% of the entire month’s activity). Spinraza is a medication that often presents a unique challenge to Medicaid programs because it is a medication given for a condition that generally skews toward child populations (and Medicaid covers a lot of children in the U.S.; more than a third).
2. Brand price trends over time
To help contextualize brand-name drug list price increase behavior, we find it beneficial to review past trends. In comparison to the data from prior months of May, this year seems to line up similarly with a total of 10 (combined increase and decreases) branded price changes. The highest number of May changes occurred in May 2015 with 81 net branded price increases whereas the lowest was in May of 2021 when there were only 9 price increases. To put it into a more recent perspective (over the last five years), in May 2024, there were a net (combined increases and decreases) of 10 medications, 16 in May 2023, 26 in May 2022, 9 in May 2021, and 21 in May 2020.

Figure 1
Source: Elsevier Gold Standard Drug Database, CMS State Drug Utilization Data, 46brooklyn Research
Moreover, when further examining our brand drug box score visualization, we continue to see May being the time of year where not much change is occurring for both brand price increases and brand price decreases. It’s almost as if those who set the pricing for medications have a touch of senior-itis this time of the year.
Of the drugs that took increases so far this year, the median price increase has been 4.9% --a percentage that has been holding steady without much fluctuation since 2019. On weighted basis, as we alluded to with our discussion on the PYME figures for this month, there hasn’t been much movement with the calculated value based upon Medicaid utilization for drugs that have taken a price increase holding at 0.8% (as shown in Figure 1)
As we have been saying pretty consistently over the last couple of months, this is a signal that the individual drugs that saw price changes in May are not that impactful (not affecting the yearly average impact of price changes) relative to the drug prices that have already occurred throughout the year (which were basically all driven by the January price changes).
3. Brand drug list price changes worth taking note of in May
While we have thus far focused on the aggregate brand picture, next we identify specific brand drugs worth taking note of in a couple different ways. Primarily, we look for medications with a lot of prior year gross Medicaid expenditures (PYME). We next look for drugs with large pricing changes (+/- 10%). And finally, we look for drugs that are interesting for us either because we’ve previously written on them, they’ve recently been in the news, or because we find them of unique clinical value. This month, when looking for these drugs in the brand arena, we found several worth mentioning based upon these reasons:
Eye Drop(s)
Natacyn (natamycin) ophthalmic drops (99.9% WAC increase; $76k PYME). This is the first and only FDA-approved topical ophthalmic anti-fungal. This eye drop took an increase in WAC of 99.9% impacting $75k in gross prior year Medicaid expenditures (PYME). The doubling of price for this product is in keeping with our observations for previous Harrow products this year. As we identified in our February report, Harrow’s acquisition of Santen’s ophthalmic portfolio was expected “to be immediately financially accretive“ for the company. Doubling the price seems in keeping with those past statements. Although, with the recent changes in MDRP, including the 100% AMP cap removal, one does wonder whether or not they’ll be giving more than free medication away to Medicaid programs for their pricing behavior (Figure 2). And in a testament to how messed up the drug supply chain can be, it’s possible that Medicaid members may face a brand copay for a medication that the program got for free (or better). Additionally, it may mean that a beneficiary who gets their medication filled at a 340B provider may pay a high-cost for a therapy the Covered Entity got for a penny (which hey, 340B providers have costs above the price of purchasing the drug, sure; it’s just a matter of how much more should be paid when something is free — thank you money from sick people).

Figure 2
Source: Elsevier Gold Standard Drug Database, US Inflation Calculator, 46brooklyn Research
*Annual 2024 CPI-U is an estimate
Topical product(s) (chest pain/cancer)
Nitro Bid (nitroglycerin ointment) topical ointment (9.9% increase; $850k PYME). This is a topically applied medication indicated for the prevention of angina pectoris due to coronary artery disease (CAD).
Valchlor (mechlorethamine) topical gel (4% increase; $2.3 million PYME) is a topical gel indicated for the treatment of Stage 1A and 1B mycosis fungoides-type cutaneous T-cell lymphoma in patient who have received prior skin-directed therapy.
Rare genetic disorder medication(s)
Daybue (trofinetide) oral solution (9.4% increase; $32 million PYME) is the 1st and only treatment for Rett syndrome, which is a rare genetic disorder that affects brain development. Note, that although half the PYME of the next medication, Daybue represents approximately 30% of the total PYME impact for this month, so worth considering if a medication within your health benefit.
Spinraza (nusinersen) solution for injection (3% increase; $63 million PYME) is a medication that requires intrathecal administration and is used for the treatment of spinal muscular atrophy (SMA) in pediatric and adult patients. SMA is a rare genetic disease that causes muscle weakness and loss over time. In 2020, this article gave insight into the WAC for this medication, which at the time was $805,000 for the 1st year of therapy and $380,000 per year thereafter. With that being said, any small change in price of this medication (up or down) will result in a significant amount of dollars being impacted for even just one prescription.
Antibiotics
Cleocin vaginal cream (clindamycin phosphate) vaginal cream (64% decrease; $186k PYME) is a vaginal cream indicated for the treatment of bacterial vaginosis. This medication saw a decrease in WAC, and given that is an unexpected observation, it is worth taking not of (in our opinion).
Zyvox (linezolid) powder for oral suspension (64% decrease; N/A PYME) is an antibiotic used to treat infections caused by susceptible Gram-positive bacteria including Nosocomial pneumonia; Community-acquired pneumonia; Complicated skin and skin structure infections, including diabetic foot infections, without concomitant osteomyelitis; Uncomplicated skin and skin structure infections; Vancomycin-resistant Enterococcus faecium infections. This medication experienced a decrease in WAC by 64%.
Bear in mind that as you read these brand drug numbers, they are the prices before drug maker rebates are accounted for, which as we stated prior are growing significantly over time and are at their largest amounts in the Medicaid and 340B programs. While these list prices are bloated and intended to be negotiated, for those who are underinsured, uninsured, or in high-deductible health plans, these “fake” list prices become very real.

Of course, our update doesn’t end with brand medications. While brand represent the majority of payer costs, patients overwhelmingly take generic medications, which means arguably what goes on with generic pricing is the most impactful to the most number of individual prescriptions — so let’s give those some deserved attention.
What we saw from generic medications in May
4. An favorable, unweighted price change picture
Each month, we start our evaluation of generic drug price changes by looking at how many generic drugs went up and down in the latest month’s survey of retail pharmacy acquisition costs (based on National Average Drug Acquisition Cost, NADAC), and compare that to the prior month. Basically, the quick way to read Figure 3 below is to look for orange bars that are taller than blue bars to the left of the line, and exactly the opposite to the right of the dotted line. That would indicate a good month – more generic drugs going down in price compared to the prior month, and less drug prices going up.
Figure 3
Source: Data.Medicaid.gov, 46brooklyn Research
As can be seen in Figure 3, many more drugs decreased in cost this month compared to the prior month. For every generic drug that had a increased in cost in May, approximately 1.7 decreased in cost (as seen by the bigger orange bars). This is an early signal that chances are this month’s NADAC will be large deflation (because a lot of drugs deflating mean they’re more likely to be meaningful drugs that deflated).
But as usual, we take this unweighted price change analysis with a grain of salt. To really make heads or tails of all of these pricing changes, we need to add a weight to these changes.
5. Weighted Medicaid generic drug costs come in at $80 million deflation
While you can track each individual drug’s NADAC over time at our NADAC Drug Pricing Dashboard, the purpose of our NADAC Change Packed Bubble Chart is to apply utilization (drug mix) to each month’s NADAC price changes to better assess the impact. We use Medicaid’s Q4 2022 and Q1-Q3 2023 drug mix from CMS to arrive at an estimate of the total dollar impact of the latest NADAC pricing update. As a reminder, we’re choosing the last full-year picture available in order to remove variances in drug mix from this equation (and focus just on the role that NADAC price changes have over time). This helps quantify what should be the real effect of those price changes above from a payer’s perspective (in our case Medicaid; individual results will vary). Said differently, if a drug that is hardly ever utilized takes a 50% decrease, it doesn’t matter as much if a drug everyone takes increases by 5% (the inverse of this is what we observed at the start of the year with the brand name insulin price decreases [see our January 2024 report]).
The green bubbles on the right of the Bubble Chart viz (screenshot below in Figure 4) are the generic drugs that experienced a price decline (i.e. got cheaper) in the latest NADAC survey, while the yellow/orange/red bubbles on the left are those drugs that experienced a price increase. The size of each bubble represents the dollar impact of the drug on state Medicaid programs, based on their utilization of the drugs in the most recent trailing 12-month period (i.e. bigger bubbles represent more spending). Stated differently, we simply multiply the latest survey price changes by aggregate drug utilization in Medicaid over the past full year, add up all the bubbles, and get the total inflation/deflation impact of the survey changes.

Figure 4
Source: Data.Medicaid.gov, 46brooklyn Research
Overall, in May, there was just over $34 million worth of inflationary drugs, but that was majorly offset by just over $115 million of deflationary generic drugs, netting out to approximately $80 million of generic drug cost deflation for Medicaid. Compare to April, which was deflationary (by $489 million), this means that while May would have been a normally impressive deflationary month, April puts it to shame.
While this shows that many drugs were experiencing a cost decrease, we know that month-over-month NADACs can move in either direction (as a reflection of the purchasing realities), so the question we next ask is how different is this month relative to year-over-year (YoY) trending?
6. Year-over-year generic oral solid deflation increased to 25.1%
Ever since June 2020, we have been tracking year-over-year (YoY) deflation for all generic drugs that have a NADAC price. We once again weight all price changes using Medicaid’s drug utilization data. This month, deflation on oral solid generics and all generics decreased to 25.1% and 21.6%, respectively (Figure 5). If you are a purchaser of generic drugs (based on the actual costs of drugs; not AWP), an increase in this metric is ideal, as it means costs are declining. Businesses generally enjoy it when their input costs go down. Historically, NADAC deflation numbers have been much higher then they’ve been recently; however, since April 2024, they have started to trend back up with some of the highest numbers that have been observed in the last three years (Figure 5).
Figure 5
Source: Data.Medicaid.gov, 46brooklyn Research
And while we truly believe that most businesses would celebrate the decrease in input costs associated with these NADAC numbers, the decreases in NADAC have not been universally welcomed. Thus, with all the persistent drug channel fuss over what’s been happening with NADAC, once again, we are breaking from our normal course syllabus of discussing a bunch of the individual generic drug price changes this month, and instead trying to make sense of what NADAC is and isn’t (as we did in our last report).
7. Making sense of NADAC (version 2.0)
When it comes to evaluating NADAC, we have a lot of experience (we’ve been professionally talking about it since 2010 in some way, shape or form — yes, even before 46brooklyn was born). It is undoubtable that something significant happened in April that had a big impact on the output of values that comprise our favorite publicly available drug pricing benchmark. If you are unaware of some of the recent changes to NADAC, please see our prior report or check out this podcast where we discuss). However, when it comes to evaluating what exactly happened — we are not convinced that it was recent changes in NADAC’s methodology that were all that significant. Rather, we think something more is going on.
To start, you may recall from our prior report on April price changes, we highlighted how many new drug products were, for the first time, given a NADAC value that month based upon the CMS report of first-time NADACs. Reporting new products isn’t likely to occur as a result of methodology changes. If the same pharmacies were participating in the NADAC survey month-over-month, odds are that they bought more or less the same type of drugs in March as they did in April or May. Ergo, a bunch of new products wouldn’t have been reported into the April survey if the same pharmacies kept on participating month-over-month (i.e., it’s not as if the market was flooded with a bunch of newly launched brand or generic drugs).
Rather, it is more likely, in our estimation, that some new pharmacy had to be have reported into NADAC (hence a bunch of new types of purchases that the typical previous pharmacy respondents don’t make). As observed in online groups where some pharmacy minds occasionally congregate, the scale of changes and their sudden appearance within the NADAC data is suggestive that a rather large purchaser of medications decided to report to NADAC where previously, they hadn’t. Which makes sense when you consider that we know that pharmacy purchases are a volume business, and the more volume of business you have, the more likely you are to dispense lower utilized drugs (particularly in sufficient quantities to enable CMS to actually report a NADAC).
However, putting that suspicion aside, it is important to note that the way CMS identifies a drug as a first-time NADAC may not align with our expectations of what is and isn’t a “real” first-time NADAC observation. What do we mean? Well, CMS may identify a product as a first-time NADAC report based upon a unique package size even though the medication has been previously available and a NADAC was previously published for a different package size of the same product (but not reported for the package size they’re reporting now). If that seems a little confusing, perhaps an example will help. Consider Furosemide 20 mg / 2 mL vial that appears in the CMS file as a first-time NADAC for April 17, 2024 (Figure 6).

Figure 6
Source: Data.Medicaid.gov
Although this product is reported as a first-time NADAC for April 17, 2024, the same strength (Furosemide 10 mg per mL), just different package sizes, have had a NADAC price well back into May 2023 (i.e., a year ago with a bunch of different NDCs; Figure 7).

Figure 7
Source: Data.Medicaid.gov
Note: We have updated our NADAC Drug Pricing Dashboard to enable selection of package size to help ease investigations into some of these observations and learnings today
So why are we bringing this up? Well, there are multiple steps that are involved in actualizing drug prices (beyond just what drug manufacturers do with list prices and what PBMs do with MAC rates), and one of them is product selection by the pharmacy (a step we will dive into today). If you were an enterprising pharmacy before this latest NADAC pricing update, it may have benefited you to purchase and acquire the non-NADAC furosemide vial, get paid at Wholesale Acquisition Cost (WAC) from your state Medicaid program and not NADAC (even though you likely bought it at a rate much closer to NADAC — see all the other options) and profited off of the different basis of reimbursement. Look at the Medicaid payment schedules to see what we mean. Below, we highlight California (the nation’s biggest Medicaid program) largely because they clearly spell out what their approach is (Figure 8).

Figure 8
Source: Medicaid Covered Outpatient Prescription Drug Reimbursement
Of course, the problem with this is plenty of people are already aware of games that take place with product hopping (though generally related to brand manufacturers, we think the term appropriately refers to generic efforts to alter package sizes, dosage forms, strengths, and new combinations as well). To address this known issue, many programs use what is generally referred to as an extrapolated NADAC to price drugs. For example, sourcing NADAC from the various drug compendia may result in access to a file that “extrapolates pricing to similar NDCs that are not reported by CMS.“ So returning to first-time generic furosemide; according to CMS State Drug Utilization Data in 2023, several Medicaid programs (both their Fee-for-Service and Managed Care Organizations) were able to price the “first-time” NADAC furosemide product in April fairly close to the NADAC of other similar products back in 2023, even though the product didn’t actually have a NADAC price point at the time (Figure 9).
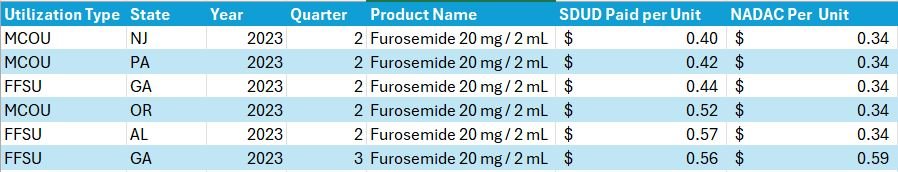
Figure 9
Source: Data.Medicaid.gov, 46brooklyn Research
Now, not every Medicaid program was able to price around NADAC (some paid a lot less, while others paid a lot more). We’re only highlighting the few that did to demonstrate the possibility of pricing these historically unknown NADAC NDCs at effectively NADAC rates — not what was accomplished across the board. Which brings us to our second point. We know that typically, outside Medicaid Fee-for-Service programs, pharmacies are not generally reimbursed for most of their dispensed prescription drugs in relation to their drug acquisition cost. In fact, we have it on pretty good authority even beyond our professional experience — look at this text from the U.S. Supreme Court’s Rutledge v. PCMA decision regarding PBM maximum allowable cost (MAC) rates (our own highlight added of course; Figure 10):

Figure 10
Source: Rutledge v. PCMA
What is unsaid in the SCOTUS Rutledge decision — but has been known since at least the 1990s — is that purchasing prescription medications is generally secured through a leveraged, volume-based contract. Leveraged discounts are not well suited to value individual drug costs, and thus, the individual purchasers of prescription drugs can face disconnected and seemingly irrational prices.

Putting aside whether or not it is reasonable to reimburse drugs at based upon acquisition cost, the reality is that NADAC is not the basis for most payer/PBM reimbursements to pharmacies. In fact, most pharmacy payments are tied to Average Wholesale Price (AWP) — either directly through a discount or reconciled against an aggregate, effective rate guarantee. And to hear some benefit brokers and PCMA tell it, benchmarking to AWP is far better — and less volatile — than NADAC. So let’s investigate that claim a little bit further, shall we?
At 46brooklyn, we have long bemoaned on these monthly NADAC updates the pricing fluctuations in ADHD medications. Going up and down month-over-month means they’re often popping up as large bubbles (either red or green) in our NADAC Bubble Chart. And while we were mostly interested in the pricing activity in an academic sense (essentially asking, what is unique about these products that causes their prices go up and down so much), because of the significant usage rates of ADHD medications across the country and its impact on families of all shapes and sizes, we figured we’d look at two commonly prescribed ADHD medications that are familiar to our team and evaluate whether we as consumers would get better pricing if our experience was governed by a supposedly “risk-mitigating” AWP-based contract or a supposedly “volatile” NADAC-plus contract.
To begin, we have to determine what we think the market rate AWP-discount is for payers when it comes to generic medications, as they are the dominant forms of utilization. Fortunately for the purposes of this analysis, benefit brokers working for public programs sometimes have to disclose the pricing they are negotiating for the plan in the public domain. Take this example for San Juan County’s 2023 PBM reprice comparison (Figure 11):

Figure 11
Source: San Juan County Board of Commissioners
Now according to the above, retail generic drug pricing guarantees seem to be at approximately AWP - 85% for most of the bidding PBMs (though the incumbent was at AWP - 77.9%, ouch). While it is true that there is some variability in the exact discount depending upon which PBM you select, we’re going to use AWP - 85% as the generic drug discount for the purposes of today’s exercise. With the discount established, let’s look at the methylphenidate extended release AWP and NADAC pricing trend over time (we chose the lowest strength, as it came first numerically) and then calculate which drug pricing paradigm would have cost patients the least if they were paying 100% of the drug costs (while a patient copay may actually be $15 per prescription, the rest is being covered by the health plan). In Figure 12 below, we trend the AWP and NADAC price over time.

Figure 12
Source: Data.Medicaid.gov, 46brooklyn Research
There is a lot to learn from this commonly used ADHD medication. First, it is not an error that the AWP line doesn’t change — it hasn’t moved since it was published back in 2017. If you value consistency — and not volatility — well, AWP certainly wins on those merits. To be specific, this version of methylphenidate has had some pretty significant NADAC swings over time (as much as a 35% decrease to a 49% price increase between NADAC publishings). Nevertheless, from a cumulative view, this methylphenidate ER is 77% cheaper in May 2024 than its original NADAC (also published in 2017). So yes, NADAC is more “volatile” than AWP, but that doesn’t seem to be a bad thing, particularly when we consider what price we’d pay if we bought the drug at an AWP discount in comparison to a NADAC plus model. Based upon the drug’s AWP, an 85% discount would value this ADHD prescription at $37.88 per 30-day supply (Note, and as previously stated, we can presume around a flat copay of $15 for the prescription, so we’re paying roughly half of the cost). This is roughly $1 per day, which is pretty affordable. However, $37.88 is still $16.91 more than the NADAC value of our prescription. Which means if we were to pay NADAC plus $10 or $11 dollars, we’d still save $6 to $7 per month with NADAC-based pricing as opposed to AWP-based pricing. In fact, NADAC was equivalent to a 77% discount to AWP in September 2020 (three years ago; i.e., the incumbent’s AWP discount for San Juan County) and an 85% discount to AWP in October 2021 (1.5 years ago). Maybe volatility isn’t a bad thing?
Consider that NADAC’s volatility ultimately led to an overall deflationary experience, which is, you know, what generic drugs are supposed to do. So while AWP-linked pricing might appear to be stable, the truth is that AWP hides — and often confiscates — the value that the generic marketplace is explicitly designed to provide. Food for thought to those that think ‘volatile’ = ‘bad’.
However, we also learned something else in preparing this — we actually decided to do a local price check at the pharmacy down the road from us — our pharmacy is buying the methylphenidate product with the highest AWP to dispense this medication. This honestly makes sense given their business incentives. Believe it or not, all interchangeable generic medications do not have the same AWP or WAC (though they likely have the same NADAC; especially if you extrapolate NADAC — see our earlier Furosemide discussion). In Figure 13 below, we graph the current AWP and NADAC values of the other manufacturers for methylphenidate ER, highlighting the one our pharmacy chose to stock and dispense relative to the others they could have purchased.
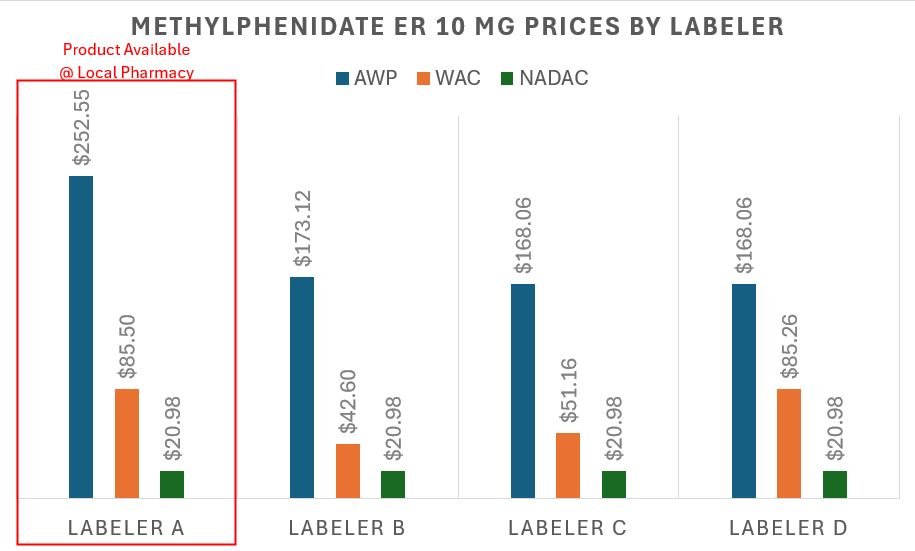
Figure 13
Source: Data.Medicaid.gov, 46brooklyn Research, our locally situated pharmacy

Figure 13 is telling us that were we the sole payers for our prescription drug (and not just paying the flat $15 copay), our AWP-based 85% discount contract exposed us to over $12.67 in price variability depending upon which product was dispensed by the pharmacy, whereas NADAC would have valued all the products equally. Based upon the $37.88 that we assume was paid, that $12.67 is roughly a 33% difference in the actual price we paid that we lost out on. This is an interesting observation when we consider that PBM MAC prices are supposed to incentivize the purchasing of the lowest cost product (though our pharmacy appeared to have missed the AMCP memo).
Now, while the above interpretation of Figure 13 focuses on our experience from a payer’s perspective, if we return to the pharmacy’s likely point of view, we can understand why they dispensed and sourced the medication they did. If we accept that pharmacy contracts are tied to AWP-based discounts, then by selecting the highest AWP product, the pharmacy likely made the most possible money (assuming the acquisition cost of all of the above was roughly equal, as NADAC suggests and incentivizes). Based upon the above, our pharmacy made $12.67 more (assuming the same AWP - 85% contract) by selecting the labeler with the highest AWP-per-unit rather than purchasing a competitor’s product with a lower sticker price. This is because the manufacturer/labeler that the pharmacy chose to utilize is setting an AWP that is 50% more expensive than the cheapest available product.
Again, we know that payer contracts are generally tied to AWP, so the payer ended up paying more for methylphenidate ER due to being in an AWP-based contract and the product selection incentives offered to the pharmacy (due to their AWP-based contract). If all parties were in a NADAC-based contract (or other form of a cost-plus model), it wouldn’t have mattered what labeler was dispensed, but that is the price you pay to “risk-mitigate“ NADAC’s “volatility.”
8. Putting the puzzle pieces together
We have often described our efforts to analyze drug pricing information in the public domain as an attempt to put together a box of puzzle pieces, knowing the box is missing some of the pieces. True net manufacturer prices and rebates remain elusive just like PBM MAC pricing lists (and more), and yet, it is our hope that if there can be sufficient information in the public domain on how drug prices are actualized, we might start to get a better sense for what the full puzzle actually looks like (even if there are some remaining blank spots).
We know from the Rutledge v PCMA decision and a variety of other commercial and Medicaid analyses that pharmacies are paid less than payers are charged for medications. This should be no surprise to anyone who has already made it this deep into a 46brooklyn drug pricing report. But it should also not be surprising when to accept the alternative is to believe that PBMs are running a bad business, giving payers lower costs than what they themselves incur to pay pharmacies for the medications they dispense. PBMs do provide a service to health plans and do incur costs related to the services they provide, which, as a business, they should be compensated for. The rub is understanding exactly what you’re paying for the services offered. If PBMs are paid via spread pricing or other forms of buried compensation, there is effectively little contractual control on the amount of money the PBM can make off the benefit; whereas if the PBM is paid a fixed fee for the services they offere, then theoretically the only way for the PBM to make more money off their client is for the client’s patients to either get sicker (use more medications that they can put fees on top of) or for the client’s business to grow (to have more covered lives because the business expanded its employee roster). In essence, AWP facilitates ambiguous, malleable spread, whereas NADAC or other cost-plus models facilitate straightforward, fixed fees. If you don’t believe us, look at the past major PBM financial statements risks associated with changes to AWP-based contracts (CVS Health [Caremark], The Cigna Group [ESI], and UnitedHealth [OptumRx]).
These dynamics can lead some to believe that AWP-based payments to pharmacies must be better than the alternative NADAC-based pricing models for the same reasons. A pharmacy can potentially improve its payment by 33% through appropriate product selection (based upon our methyphenidate ER example above). However, recall that we know that pharmacies are always not paid what payers are charged, so that isn’t exactly true. So what piece is missing from the puzzle?
Pharmacy providers buy prescription drug inventory from wholesalers in order to then sell that inventory to customers based on their healthcare needs, as indicated and communicated to pharmacies by prescribers' drug orders (not patient requests). While pharmacists can suggest alternatives, like substituting a generic drug for a brand-name one, they generally can't direct patients to specific prescription medications (i.e., the specific drugs that make them the most money if they were to only follow their business’ financial incentives). In other words, a pharmacy can't sell a profitable diabetes medication to someone who doesn't have a prescription for it, as this would be unsafe and potentially life-threatening if that patient didn’t actually have diabetes.
Therefore, pharmacies can't simply chase the most profitable drugs based upon reimbursement incentives alone. As a result, pharmacies aim to minimize financial losses by avoiding medications that result in underpayments. Pharmacies track which medications are profitable and which are not. When losses become concentrated in a particular drug, a pharmacy may stop purchasing that therapy to improve financial performance (hoping the patient doesn’t take any other more favorable prescriptions with them when they go fill that unfavorable prescription somewhere else). This practice is documented publicly. For example, a 2018 report by the Columbus Dispatch highlighted how Ohio pharmacies were de-stocking generic Suboxone prescriptions due to low reimbursement rates from PBMs. We’ve also seen this phenomenon play out within the GLP-1 craze, as pharmacies have been refusing to stock some popular weight-loss drugs due to the poor economic climate associated with their dispensing and reimbursement.
Which ultimately brings us to the news out of our home state of Ohio and that one other state up north where Rite Aid is reportedly shutting down nearly every pharmacy within the states, with apparently Walgreens soon to follow with a number of closures as well (at least with national closures). This is occurs amidst a series of Ohio independent closures, including Whitacre’s, Plain City Druggist, Berry’s, and more. We know Ohio isn’t alone, as the number of closures nationally feel especially voluminous as of late (time will tell of course; it’s just our current finger-in-the-air assessment).
Pharmacy is signaling that it is facing financial headwinds following DIR reforms, NADAC price decreases, payment that isn’t rationally tied to drug acquisitions costs, and a number of workforce challenges. Nevertheless, the contraction of the pharmacy chain marketplace would seem puzzling considering the financial incentives of our convoluted drug pricing system. Rite Aid and Walgreens are presumably in AWP-based contracts with large PBMs like everyone else. As a result, they’re subject to the same leveraged, volume-based discounts that don’t really value individual drug purchases in relation to acquisition cost, but rather secure value in the aggregate off inflated sticker prices. So although they may shutter locations that they deem under-performers, their AWP-based contracts with PBMs are still going to indicate that some drugs will be losses while others will be winners (presumably nothing material will change with their network agreements amidst the retail shakeout). All these chains will have done is reduce their purchasing power with their wholesalers (through less locations, with less volume). If the largest retailers have insufficient leverage to achieve contracts that support, sustain, and grow their businesses, then perhaps that observation, more so than any other, should signal to pharmacy providers that the AWP-based pricing model is not in their best interest.
As we observed in our last report, there is so much interest in drug prices — with so many different ways to contextualize price — that a payment model for price takers (not price setters) predicated on profiting through deception on drug prices is likely not to succeed (at least in our opinion), particularly when you’re the last line in the drug pricing food chain (i.e., accepting that all drug channel participants generally are trying to feast on fake, artificially inflated drug prices).

This brings us back to a crucial question we increasingly find ourselves asking: What do we want drug pricing policy to actually achieve? If the goal of public policy is to develop the most innovative treatments, we must recognize that innovation is costly, and therefore, high drug prices are to be expected to pay for the investment for that innovation. One could argue that our drug supply chain has succeeded in fostering investment for innovation, as evidenced by the fact that U.S. medication prices are among the highest in the world — a point that, while not without controversy, suggests a success on cutting-edge therapies.
However, if the goal is to ensure health equity, we must acknowledge that we are far from achieving it. If AWP-linked prices continue to dominate the experience of payers (health plans and patients alike), then the cost of ‘stability’ in price offered by AWP is to further the dysfunction we have observed time and again as it relates to drug pricing.
So, our summer school work challenge is this: What should drug pricing aim to accomplish and how do we articulate what we’re willing to give up to accomplish whatever our goals actually are?
Big shout-out to the Federal Trade Commission for including our specialty drug analysis in their big interim report on pharmacy benefit managers this month. It was great to see our work referenced but also to see the FTC building upon previous 46brooklyn analyses that demonstrate some of the drug pricing distortions we have uncovered in the marketplace. Additional thanks to Matt Stoller for highlighting our work in his recent deep-dive into the complicated history of PBMs and the FTC’s work.
Thanks to our good friend Mike Koelzer at the Business of Pharmacy Podcast for recently chatting with 46brooklyn CEO Antonio Ciaccia on the latest happenings in the drug supply chain and the need for greater transparency and accountability in pharmacy transactions.
Check out this long-from look at the PBM marketplace and its impact on prescription drug prices featuring 46brooklyn from UNFTR.
Lastly, thanks to Ngozi Cole with the Ohio Newsroom for chatting with Antonio Ciaccia about a recent wave of pharmacy closures in the Buckeye State.