
Money from Sick People Part IV: Paying a Premium for Drug Pricing Irregularity
Insuring Against the irrational
As we stated in our last installment of our deep-dive “Money from Sick People” series that examines how prescription drug discounts can lead to inflated prices and inequitable access to medicines, we understand and recognize that drug pricing is complex and subject to many potential different perspectives on the same set of facts. However, we view one of the principal problems in trying to understand drug prices is that policymakers have not decided what they want drug pricing policy to actually accomplish (we recently raised this point in our review of May 2024 drug pricing changes). Without a guiding principle or philosophy to act as a beacon for policy end goals, drug prices may be experienced across any number of potential paradigms and serve many potential goals – which often results in many drug prices for the same product. In other words, the observations of price discrimination in the drug supply chain has become a feature, not a flaw, within the U.S. healthcare system.
We know that drug prices – at least the prices experienced by the end payer – are not set in accordance with the price a pharmacy pays to acquire those medicines. In the landmark Rutledge v PCMA decision, the U.S. Supreme Court put this fact out there relatively simply, succinctly, and in a unanimous manner by stating, “The amount a PBM ‘reimburses’ a pharmacy for a drug is not necessarily tied to how much the pharmacy paid to purchase that drug from a wholesaler.”
We struggle to think of other industries where the provider of a product (i.e., the pharmacy) would have such little say in establishing prices in relation to the products it is offering and their corresponding underlying costs (and yet that is what we know happens with drugs). That is not to say it doesn’t happen, just that our perception is that when a grocer wants / needs a higher price for milk they raise the price for milk, when a pharmacy wants / needs a higher reimbursement to cover their costs they…well, we’re not sure what they can do immediately to improve their price like grocers or others can do (which is the point we’re trying to make). We also know that drug pricing is more variable (i.e. there are many prices for the same product) than a single manufacturer’s price point could possibly yield.
Undoubtedly, the price of a medication starts with a manufacturer, but it certainly doesn’t end there – nor can it be completely understood by just the manufacturer price point. If the price paid for a medicine was solely derived by the price set by the manufacturer, then everyone’s pricing experience would be consistent. But it isn’t.
That fact does not stop some from claiming that drug manufacturers, and drug manufacturers alone, are responsible for drug pricing. Conversely, it doesn’t stop the same groups from claiming that they alone are working to lower drug prices. Such simple views on drug pricing should be rejected, as they are undoubtedly not founded in the facts. And to help explain why, today we demonstrate just how all-over-the map U.S. drug prices are by revisiting the prices of insulins in the aftermath of the big insulin drug list price cuts that took place at the start of the year.
Background
Insulin has been the poster child of drug pricing dysfunction for decades. Unsurprisingly, insulin has been a frequent flyer in our Money From Sick People series, as a lot of effort has been directed at trying to understand how a life-saving medication (people with Type 1 Diabetes will die without insulin) can for some be an affordable medication, whereas others post tragic videos highlighting their inability to get the medication they so desperately need. While there are many potential insulin products, the variability in patient experience is itself demonstrative of how an insulin product, with a manufacturer list price, and a price paid by the dispensing pharmacy to acquire it, can yield such divergent perspectives on insulin prices.
Whether directly related to these patient stories or not, legislation was passed, signed into law, and enacted which capped the amount of money Medicare beneficiaries can be required to pay to get a month’s supply of insulin. The Inflation Reduction Act capped the monthly price of insulin at $35 for Medicare enrollees starting in 2023. Which means regardless of the historic harms with insulin we have showed with rebates (Money from Sick People Part I) or a provider’s deeply discounted acquisition cost (Money from Sick People Part II), Medicare enrollees can expect some form of price protection from these past behaviors. Undoubtedly a good thing.
However, the value of those savings are perhaps less than when originally envisioned. Why? Well, insulin products (not all, but the majority from a utilization standpoint) took price decreases (like massive, 70%+ decreases) in 2024. For those who may have missed it (undoubtedly not a regular 46brooklyn reader), five insulin products took significant drug list price decreases at the start of January 2024 (technically some squeaked in the last week of 2023, but we’re calling those 2024 price decreases). Specifically, as shown in our Brand Drug List Price Box Score, Figure 1 below outlines the product and the extent of their price decreases:

Figure 1
Source: Elsevier Gold Standard Drug Database, 46brooklyn Research
The significance of these price drops was not lost on us, given the history of controversy surrounding the insulin marketplace dynamics. And while there some good coverage of these big cuts, we understand why more casual observers may have missed them, since the years of headlines of rising insulin prices far outmatched the coverage of their cratering.

Figure 2
Source: Elsevier Gold Standard Drug Database, CMS State Drug Utilization Data, 46brooklyn Research
These drugs, which were priced at several hundreds of dollars per package previously, are all now below $100 a package (at least, on the basis of the manufacturer set-list price). The impact of these price decreases are such that they more or less broke our perception of manufacturer list price behavior changes broadly (at least as measured within our Brand Box Score in Figure 2). This is because these products represent a lot of historical proportional drug spending, and so when we attempt to weight price change experience across brand drugs, we perceive almost no list price change behavior for 2024; a first-time observation in more than a decade of drug pricing context (see previous discussion of the phenomenon and the Brand Drug Pricing Box Score).
To demonstrate just how important these products are to our broader prescription drug ecosystem, the five insulin products outlined above had over $11 billion in gross drug spending across almost 14 million prescriptions in 2022 in Medicare (the last year that has public data available regarding Medicare spending and utilization). These products are significant enough to represent roughly 1% of drug utilization in Medicare and 5% of gross drug spending. Said differently, one in 20 dollars spent at the pharmacy counter in Medicare was an insulin dollar.
Unsurprisingly, the list price reductions received a lot of positive praise from a variety of sources – and yet, we still cannot reasonably explain insulin prices at the pharmacy counter in relation to the manufacturer list price or the pharmacy’s cost to acquire. What do we mean?
Well, consider what we might perceive to be the importance of these price decreases relative to the value offered from the $35 insulin copay cap. To do this, we will look at the full wholesale acquisition cost (WAC) price for the most commonly utilized Medicare insulin – Lantus (we’re going to specifically look at the 10 mL vial; this is one we’ve previously used in our Money From Sick People series, so it helps keep things consistent). In 2023, before Lantus’ price decrease, one vial of Lantus ran $292, which means that the Medicare $35 copay max would have meant a patient was paying roughly 10% of the manufacturer’s list price. In 2024, after Lantus’ price decrease, one vial of Lantus now costs $64, meaning that the $35 cap means the patient is paying around 54% of the manufacturer’s list price.
What we can start to see is that while it can be beneficial to some for manufacturers to lower their price, the end result of list price decreases is not one that is guaranteed to be universally of benefit. We all (including Medicare beneficiaries) have to pay money (via premiums) to get access to the benefit of cost sharing for medicines at the pharmacy counter (i.e., the $35 cap vs. the full manufacturer list price), and how much value our premium dollars secure (i.e., how much protection we get from gross prices at the pharmacy counter) is a function of how much value the health plan passes on to the end-user. This was the point we made back with Money from Sick People Part I in regards to rebates, but may need revisited in light of lower priced insulins. If that sounds intriguing, then read on to our analysis of “Money from Sick People” Part IV, where we attempt to explain how messed up insulin drug prices remain using the largest insurer in the country: Medicare.
Mission accomplished: Manufacturers lower insulin prices
Undoubtedly, there are some who have more or less exclusively advocated for the idea that if drug manufacturers would just lower their drug prices, we would all benefit. Certainly, we can understand how if one believes that drug manufacturers are alone responsible for the end drug pricing experience, then advancing and advocating for policies that would cap manufacturer prices would seem to make sense (if we accept the premise that price controls would have no other collateral harms). If the matter is as simple as manufacturers setting lower list prices, then success would be measured relatively simply for the insulin products outlined above. Said differently, we know the degree to which manufacturer list prices for insulins changed – with price cuts that range from 65% to 78% – and so we would expect that if the degree of those list price changes correlated with the changes in insulin prices experienced in Medicare, then we would undoubtedly be able to claim drug pricing success. The set up was such that we could not resist taking a look.
So, rather than listen to the words of advocacy groups, let’s ask the question to Medicare’s own drug pricing data: Are drug companies alone responsible for the prices we pay for medicines?
To begin, we need to discuss our data source for this analysis. The Centers for Medicare & Medicaid Services (CMS) publishes in the public domain a set of files referred to as the “Quarterly Prescription Drug Plan Formulary, Pharmacy Network, and Pricing Information.” As described by CMS, these files provide information on Part D formulary, pharmacy network, and pricing data for Medicare Prescription Drug Plans and Medicare Advantage Plans. Specific to drug prices, which is what we’re interested in (this is 46brooklyn, duh), CMS states the pricing information provided reflects “plan level average monthly costs for formulary Part D drugs.” Digging deeper (see FAQ), the pricing information is actually broken out in a couple ways, such as being potentially variable whether the day supply is 30 or 90 days for the plan, but should reflect, “the average cost for the day supply at in-area retail pharmacies for the Medicare plan.”
In a way, and as a quick sidebar, these acknowledgements by CMS are welcomed by those of us at 46brooklyn, as they represent, from a certain point-of-view, that drug pricing is not subject to just the manufacturer list price. Why would we need to acknowledge that a 30-day unit price may not equal a 90-day unit price if manufacturers alone were responsible for drug prices. In case it isn’t obvious, manufacturers have no bearing on the day supply of the prescription dispensed, rather that is a function of patient need, prescriber decision making, pharmacist approval, and plan benefit decisions to allow or disallow the practice of extended days supplies. And yet, we accept and acknowledge that prices are variable based upon days supply such that we also acknowledge the forces beyond manufacturer list price.
With the assurance gathered from the background on the CMS data source, we pressed ahead with gathering these files for 2023 and 2024 such that we could compare the Medicare insulin pricing experience pre- and post-drug manufacturer list price decreases at the Medicare plan level. As the files are published quarterly, and not all of 2024 has elapsed, we elected to grab the Q1 files for both 2023 and 2024 to have as ‘apples-to-apples’ comparison as we could set up at the start. In this way, we can directly observe who did and who did not benefit from drug list price decreases and hopefully see if list price changes resulted in a shared universal experience for all (spoiler alert: they did not).
As way of quick reminder, we have already acknowledged that as of January 1, 2023, there has been a cap for a month’s supply for each insulin product in Medicare. Specifically, no prescription drug plan in Medicare can charge more than $35 per month’s supply of each insulin product (regardless of whether the insulin is a preferred or non-preferred product). We make this note of distinction because the Medicare plan cost does not necessarily equal the Medicare enrollee’s cost (at least not directly).
As we already demonstrated, the perception of value of the $35 patient out-of-pocket cap changed based upon these list price changes, but we’re principally gathering the pricing data from Medicare to analyze the plan’s drug pricing view (as patients are already shielded from past Money from Sick People policy). Again, and for emphasis, CMS states the pricing information we’re relying upon reflects “plan level average monthly costs for formulary Part D drugs.” Nevertheless, if manufacturer list price = drug price (and nothing else matters in that equation), then we expect a list price decrease to perfectly equal a plan drug price decrease.
A few more housekeeping items before we get into the analysis … We pay premiums for insurance, including in Medicare, in part to access coverage and get financial protection against potentially costly claims. If there are more claims or higher cost claims, the cost of insurance premiums will go up (regardless of whether we’re talking drug costs or homes or cars). For prescription drug insurance, the prices we’re reviewing are the gross drug prices of the plan (which our analysis will focus on), and we should acknowledge that regardless of our findings on plan costs, patients needing insulin were more or less protected at the pharmacy counter from the pricing disparities we are going to investigate (though that may or may not have benefited them in the end). Furthermore, we should also recognize that for 2024, changes in the handling of Medicare direct and indirect remuneration (DIR) require that pharmacy prices reflect the “lowest possible reimbursement” for a Part D drug. We interpret this to mean that while the 2023 prices we will review may be inflated by a degree of unknown pharmacy DIR, no amount of pharmacy DIR would be anticipated to reasonably explain any observed differences in the 2024 files (given the rule). This is important, as it represents a potential difference in perception to interpreting the 2023 price variability that cannot be readily used to explain any potential 2024 price variability.
There is always more to say, but we think that is sufficient enough background to begin. As always, we encourage our readers to read the information of the underlying data source (i.e., the Quarterly Prescription Drug Plan Formulary, Pharmacy Network, and Pricing Information) before we begin to offer our perspective on what these drug prices mean.
Analysis
Digging into the data, we inevitably elected to start with the Q1 2023 file (it came first chronologically – which means all of this information was knowable before the 2024 Medicare plan bid process got completed). We start by limiting the data within the files to the five previously mentioned insulin products (that took those large price decreases). We begin by identifying each of the specific drug products (i.e. dosage form and strength) at the NDC-level and then identifying the minimum reported Medicare Part D plan unit price, the maximum reported plan unit price, and the total number of unique prices reported for that drug across all Medicare plans in Q1 2023. While the effort to interpret these Medicare files can be a little bit daunting, the beauty for today’s analysis is we’re talking about brand drugs where there will not have NDC variability. Said differently, while perceptions of manufacturer list price for generics can be influenced by the specific labeler selected amongst the various interchangeable NDCs, we don’t have that concern with today’s exercise. From there, we limited prices based upon the 30-day reported unit price for the purposes of consistency across the various products and plans (in our review, not all plans had a 90-day unit price so the selection of 30-day arguably aligns with the most common experience). In the table below we identify on a product basis our observation of insulin prices in Q1 2023 based upon the number of unique prices observed, the minimum observed unit price and the maximum observed unit price.

As can be seen above, insulin drug prices in 2023 were highly variable – certainly more variable than the drug manufacturer list price would seem to allow. Take the first row as an example. There was just one WAC unit price for Apidra Injection Solution 100 unit/mL, as set by the manufacturer Sanofi, and yet Medicare plans took that one price experience and reported no less than 28 different prices across a range of experiences ($26.92 to $30.76; $3.84 per unit delta; maximum price 14% higher than minimum). And that was a stand-out, not because it represented a one-off occurrence, but rather because it represented one of the low-end ranges for number of unique prices and min-to-max price range deltas within Medicare. Let’s look at another Sanofi product, where again, there is just one manufacturer list price. Lantus, one of the most utilized insulin products in the country, had thousands of unique prices with the high price of the SoloStar pen being 61% more than the low-end price.
The five insulin products represent 20 unique, individual drugs (based upon the idea that a unique, individual drug represents the active ingredient, dosage form, and strength actually prescribed). Undoubtedly, trying to draw conclusions from a table of 20 products can be a little bit challenging, but let’s start at a high level and then look at an individual drug example.
Despite each product representing just one brand product line (i.e., Apidra, Humalog, Lantus, Levemir, and Novolog), with one brand manufacturer-set list price (i.e., only one list price for Lantus 100 unit/mL vial -$292 in 2023), the approximate 5,000+ different Medicare plans were setting highly variable prices for the drug (more than 2,000 unique Lantus 100 unit/mL vial prices). The figure below simply graphs the total number of unique prices for each product observed in 2023.

While this variability in drug pricing may make even the nastiest rollercoaster envious — it may not be directly significant to Medicare beneficiaries at the point-of-sale (see the earlier mentioned $35 cap on insulin for Medicare beneficiaries) — it arguably was impactful in the aggregate. Recall not everyone in America gets access to low cost sharing amounts at the pharmacy counter (i.e., $35 insulin cap), and in order to access to lower than list prices for drugs, you must enroll with a Medicare prescription drug plan and pay the monthly premium. If you are subject to a $35 cap on insulin, then sometimes the premium paid to get access to the cap via your insurance in the first place, represented more or less value. Consider that in the Lantus 100 unit/mL figure above, the $35 copay cap on insulin represented roughly 12% of the total low-end Lantus price (based upon 1 package size of 10 mL; $276.89) or 9% of the total high-end price ($386.06).
As drug prices ultimately influence monthly prescription drug insurance premium amounts, this variability is important to take note of. The more high-end prices that prevail, the higher the premium will need to be in the future to cover the underlying expenses. That can be problematic for seniors regardless of whether they are protected from experiencing the cost at the pharmacy counter or not. Said differently, in some ways, the plan price (although unknown to the patient at the pharmacy counter) can be just as important to the patient experience as the copay when viewed from a system perspective. A relatively low cost sharing amount from the patient that required a large premium to secure may not be all that much of success in the end.
Examining the historic trends some more, we can see that there was quite a range of low-to-high price experiences historically. The narrowest band in 2023 (based upon the Q1 file) was for Apidra SoloStar Subcutaneous Solution Pen-injector 100 unit/mL, which differed by 9% from low to high ($34.68 to $37.86 per unit; $3.18 delta). Apidra is the least utilized of all these insulin products within Medicare (just $6 million out of the aforementioned $11 billion figure in annual Medicare insulin spending). However, the largest pricing range was for HumaLOG KwikPen Subcutaneous Solution Pen-injector 100 unit/mL, which was a four-fold difference from low to high ($10.04 to $41.28 per unit; $31.24 delta). In some ways, if we really think about it, the high delta is to be expected (how else could so many unique prices be created unless there was a big range of experience); however, it also shows how the value of the prescription insurance we purchase is largely a matter of perception. If we focus only on our cost sharing at the pharmacy counter, we miss how that cost sharing figure was recognized to begin with (i.e., the premium paid to secure it).
The average Medicare Part D premium, at least in 2024, is approximately $50 per month ($43 to $55.50 depending upon how you handle the calculation of the average). The amount of premium to be paid by an enrollee of a particular Medicare plan is arrived at via a highly regulated process that includes Medicare seeking bids from potential contractors on the cost to provide prescription drug benefits. While we could all probably benefit from a better understanding of how the bid process works, it is not necessary for today’s exercise — we simply need to understand that it costs roughly $50 per month to enjoy the benefits of lower drug costs at the pharmacy counter with Medicare insurance, such as the $35 cap on insulin prices (though manufacturers have generally indicated they’re attempting to make that $35 cap universal). If we cannot pay the premium, we cannot get the cap. But if the premium becomes out of reach because it is arrived at by factoring in underlying plan drug costs that are highly variable — subject to which plans members actually select regardless of the manufacturer list price — then what protection to drug pricing are we really buying (even with a insulin copay cap?).
To explore that, let us leave the past (Q1 2023) and examine insulin prices in Medicare in 2024. Recall that this is after each of the above-mentioned insulin products took list price decreases of approximately 70%. What we see in the table below is that a 70% decrease does not make insulin prices any less variable (in fact — the low to high price ranges are even more variable than before). Nor does a 70% list price decrease universally translate into a 70% lower plan price (and why should it when plan prices were not universally related to list prices in 2023?).

While not immediately clear, arguably the Medicare Part D plan drug pricing experience is more variable in 2024 than it was in 2023 (note the published price goes out to four decimal points, so not all identified unique prices may be significantly unique (at penny-level significance), but interesting nonetheless). In Figure 6 below, we compare the dollar range of price from high-to-low on a per-product basis across both the 2023 and 2024 Medicare experience
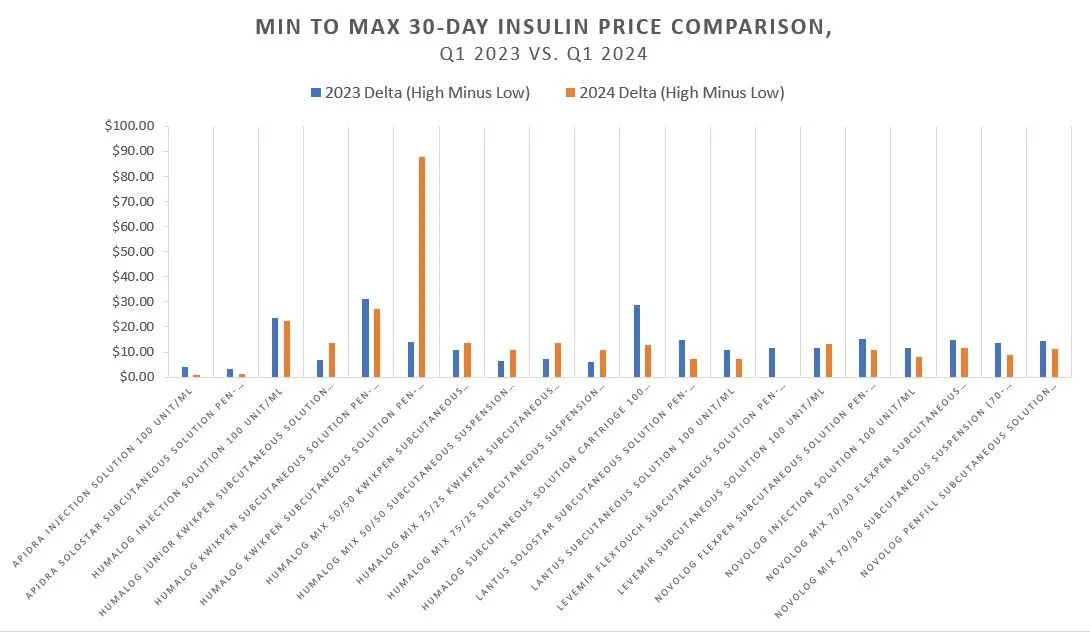
With few exceptions, most drugs have a smaller dollar range in 2024 than in 2023, but that is not universally true. Our first signal that something may be a little out of whack with the belief that manufacturer price = drug price (or at least manufacturer price = plan price). While the above can be a little difficult to read, we provide the below Figure 7 that selects just one representative version of each of the five insulin products (the vials, which did not necessarily have the most significant ranges from the above chart but are consistent with what examples we’ve used historically).

Again, Figure 7 shows us that while most ranges got smaller (on a dollar basis) from 2023 to 2024, it wasn’t universally the case. While the pricing differences are obviously of different raw dollar significance, they’re also significant as a proportion of the drugs “price“. For example, Lantus vials in 2023 had a price range of almost $11 per unit from low-to-high in 2023 ($27.69 to $38.61) compared to $7 per unit in 2024 ($3.61 to $10.93). While the $11 range is a bigger dollar difference than the 2024 $7 amount, the scale of difference in 2024 is arguably more, as the $7 delta represents a higher multiplier from low-to-high experience. Specifically, the $11 per unit price delta for Lantus in 2023 was approximately 39% of the minimum reported 2023 price, whereas the $7 delta in 2024 is 202% the underlying minimum reported 2024 price. If we all want access to the low drug price, a 200-fold difference from high to low doesn’t sound very appealing (at least to those at the top).
At the same time, other drugs, like Apidra, did get less variable from 2023 to 2024. To try and get a better assessment of the data (given the various prices across the five different insulins and their different price decreases), we attempt to re-contextualize the figures above based upon the percentage differences minimum-to-maximum as a proportion of the underlying minimum price for each year in Figure 8 below. Said differently, we’re attempting to present the information above in a manner that scales each the same regardless of the individual dollar price differences.

Again, we pull out just the vials to make interpretation of the above a little easier:

Maybe you think the above is not a fair characterization of the behavior, and rather we should compare the deltas from low-to-low and high-to-high to the list price decrease to observe whether the drug manufacturer price decreases resulted in equivalent better Medicare pricing? In the below figures, we do just that (all drugs and then just the vials; but don’t miss that there is a product whose top end price is 2024 is higher than even the top end 2023 price despite the product taking a 70% price decrease).


It should not be lost that for at least one insulin, the maximum observed price in Medicare plans is higher in 2024 than it was in 2023 (despite that product being associated with a 70% manufacturer price decrease). Digging a little deeper, we asked the data to compare these 2024 maximum Medicare plan prices against the underlying WAC unit price, and imagine our surprise when universally, the highest possible Medicare unit price was actually higher than the underlying WAC unit price. While we don’t have the latitude to publish the specific WACs (per our data license agreement), we can give a sense for the degree of variance above WAC (Figure 12). Just know that the range of price variability was 2% to 286% above WAC for the collection of individual drugs these five insulin products represent. (Note: that because the experience is so variable high to low, a $ sign in Figure 12 below does not represent the same step up each time).

Figure 12 is an encapsulation of the point we raised at the start of this report – overly simplistic views on drug pricing should be rejected, as they are undoubtedly not founded in the facts. To hear some say, in regards to insulin no less, that “Drug manufacturers alone set and raise drug prices, and PBMs are holding drug companies accountable by negotiating the lowest possible cost for drugs, including insulins, on behalf of patients.“ are clearly statements not founded in the reality of the data. To be clear, our review of the Medicare today has focused on the extremes – both high and low – and if we look at the most common prices (whether average or median), we would undoubtedly find that prices are at or below manufacturer list prices for these products; however, how can such variability on price possibly represent the “lowest possible cost” when there are so many prices higher than what is clearly identified as the minimum? Said differently, how can a multiple to the fake, artificially inflated list price possibly represent the “lowest possible cost?”
Whether a function of the historic pricing disparity or a broader reflection of the irrational manner with which drug prices are arrived at within the Medicare program, it should be noted that there is still a significant range of experience in insulin prices despite the drug price decreases (and none could be universally identified to have a direct 1-to-1 relationship between the manufacturer list price decrease and the end Medicare price experience for the drug product). We interpret the above to represent that despite both, 1) protecting patients from bloated, disparate drug prices through cost sharing caps (i.e., $35 per month max); and 2) drug manufacturer list prices decreasing (70%+ WAC decreases), the end result was a lack of a universal experience for insulin product pricing for Medicare plans. Said differently, the price of insulin is not a direct function of the manufacturer list price, the insulin copay, and/or the combination of both.

So what is missing from our equation above? Did patients enrolled in Medicare Part D really benefit from the big drug manufacturer list price decreases on insulins? That remains to be seen. We know that prescription drug premiums for Medicare went up from 2023 to 2024. It cost more to get the benefit of the $35 insulin copay cap in 2024 than it did in 2023 as a result of the higher average premium; however, it would be unreasonable for us to tie that premium increase fully to the actions of insulin prices.
Premiums are supposed to provide protections against the pooled risk of the insured individuals, which means new drug launches, first-time generic releases, changes in health status, and a litany of other things can impact the overall premium figure. However, if you are a patient in Medicare who takes insulin and whose drug therapy hasn’t changed from 2023 to 2024 (i.e., the specific drugs you’re taking are unchanged), then arguably you don’t appear to have benefited from the insulin price decreases. Think of the math this way, the average Part D premium was $40 in 2023 and $43 in 2024. In both years, a Medicare enrollee had the $35 cap. So if you got the average Part D plan (at the premium cost) and paid the caped insulin cost (again, these are just averages, individual plan results may vary), it costs more money to get insulin in 2024 ($43 premium per month + $35 insulin cost per month) than it did in 2023 ($40 premium per month + $35 insulin cost per month) despite the drug being associated with a 70%+ list decrease.
Insuring the irrational drug pricing world
If you haven’t connected the dots between irrational drug prices and money from sick people, perhaps our final attempt will help. Imagine you have been recently hired to develop the premium rate to be paid for health insurance. Whether you're aware of it or not, actuaries craft premium rate structures through meticulous analysis of projected claims and administrative expenses. Factors that are considered include claim costs (which in turn reflect provider prices, utilization, and enrollee demographics and heath status); administrative costs; and some combination of risk charge, contribution to surplus, and profit. How would you develop an estimated premium in the face of a thousand different prices for one insulin product (to say nothing of how that compounds across the half dozen or so insulin products that may be used [not all insulin products took a price decrease]).
We've previously stated that when there are a dozen different prices, there are effectively no prices. Transparency in pricing isn’t a cure-all for the dysfunction of drug pricing; rather, it equips those with the knowledge and means to enact positive changes (see the American Academy of Actuaries statements re: price transparency). Matt Stoller just wrote an enlightening piece on drug pricing and pharmacy benefits, which we highly encourage you to read (with particular attention given to the discussion on price discrimination). If your job was on the line to develop the rate we were going to pay (i.e., premium) to get our protection money (i.e., low cost sharing) against the irrational world of drug pricing, are you going to err on the side of setting a higher or lower rate?
In our Money from Sick People series to date, the focus has been about how sick patients front big out-of-pocket costs that yield discounts that aren’t being used to offset their inflated experience at the pharmacy counter. Thanks to policy changes, Medicare no longer subjects diabetic patients to these perverse forms of cost-shifting. However, just because the problem of distorted, inflated drug prices is shifted away from the point-of-sale, it doesn’t mean that the problem has been vanquished. When an intermediary has the ability to create hundreds of different prices for the same medicine from low to high, from a certain point of view, anything that surpasses the low point is an added cost.
Ultimately, the bill of drug pricing dysfunction comes due regardless of where in the spectrum it is experienced. In other words, we can create a world where the copay of insulin is capped, but one way or another, the full balance will be paid. So until something materially alters the architecture our system of inflated, disparate prices, expect Money from Sick People to live on.