
How Mark Cuban reveals hidden costs of variable drug prices in Medicare
Setting the table

Prescription drug prices in the U.S. are not necessarily founded in a consistent, objective reality, but instead arise in different shapes and forms from a variety of places within our drug supply chain. They’re like healthcare’s version of sandworms.
Undoubtedly, the price of a medication starts with a manufacturer (and the price they set), but it certainly doesn’t end there — nor can it be completely understood by just the manufacturer price point. A manufacturer principally sells their physical products (i.e., medications) to wholesalers, who themselves want to make money off the drug prices (applying some mark-up to them; often not equally to all drugs or all customers), as do pharmacy providers (they have costs beyond the acquisition cost of medications that they most recoup to maintain their business via the sale of drugs). Much has been made about the vast pricing inconsistencies within drug purchasing. And while there are those that seek to deny how variable prices are, the simple truth is the data is not on their side.
We explored this disparate pricing experience late last week in our look at the prices of insulin in the Medicare program. While we recommend reviewing that piece in advance of reading this report, as a means of creating a better foundation of knowledge such that the below learnings can be more readily understood and digested, the gist of it is this:
At the beginning of the year, five big insulin brands took list price cuts of around 70%. Meanwhile, Medicare had already capped patient out-of-pocket for insulin prescriptions at $35. With that in mind, we checked the Medicare plan data to see if the prices yielded by plans and their pharmacy benefit managers (PBMs) in the program matched the rate of decline of those list price cuts. After all, if manufacturers alone set and control drug prices, we should have seen a corresponding cratering of Medicare plan prices for those insulins as well. But we couldn’t draw a direct line between manufacturer price and Medicare plan price. In fact, as we examined the dips, what we noticed was that many of these insulins had vast price ranges between the different Medicare plans, yielding thousands of different prices across the program despite being the same drugs, with the same list prices, being paid for at the same time.

What we saw in last week’s analysis of insulin prices in Medicare is that despite public policy ending the perverse "Money from Sick People" experience for diabetic seniors at the pharmacy counter – where insulin discounts were generated by sick patients but not passed back to that sick patient – the problem of disconnected and inflated prices in the Medicare program persists, creating quite a perplexing mess.
Despite PBMs saying that drugmakers alone set and control prices, and that they negotiate "the lowest possible cost for drugs, including insulins, on behalf of patients,” CMS Medicare Part D data showed a far more nuanced reality, where PBMs and health plans are providing significantly different prices, which by definition demonstrates disparate price-setting capabilities beyond the "oneness" PBMs have identified. Our observations of the data show, at times, a price that exceeds even the list price set by the manufacturer to begin with; or at least, what we were told was the origin of drug pricing reality to begin with by PBMs.
Regardless of these pricing discoveries with insulin, the fact remains that many find drug prices at the pharmacy counter affordable; how else would you explain the roughly five billion prescriptions filled in 2023? However, that number cannot tell us how many needed prescriptions went unfilled or delayed due to cost constraints. We know it happens, but it is hard to objectively quantify an observation of something that did not occur but otherwise would have. Perhaps one of the challenges in trying to understand drug affordability is the fact that despite more people having insurance now than ever before, we still face affordability challenges with medication access.
Since the end prices paid for a medicine are inconsistent and highly differentiated, we have a variety of drug pricing benchmarks in the U.S. that seek to quantify their many iterations. We’ve got a podcast series that goes over a bunch of them.
But even beyond those benchmarks, what often goes overlooked is the fact that drug prices arise, at least via insurance, in reference to the type of health plan we select. And despite perceptions that we may have regarding the uniformity of plans offered by one group (or the parent organization of those plans), the reality is that the experience of drug prices is hardly uniform, as we showed in last week’s insulin report.
In today’s report, we will build upon our insulin learnings and the Medicare pricing data by expanding our analysis into exploring pricing variability in the generic drug marketplace and by adding another dataset into the mix: the publicly-available pricing data from Mark Cuban Cost Plus Drug Company.
Disclosure: Outside of our work at 46brooklyn, our team members provide consulting and data analytics support through 3 Axis Advisors to Mark Cuban Cost Plus Drug Company, but this report is being conducted on our own accord, independent of that professional consulting engagement.
Drug benefit design in the news
Back in the latter half of 2023, we had begun looking into Medicare drug pricing in new ways beyond our typical Part D Dashboard. Our focus at the time was largely in trying to understand what might happen with the much anticipated changes to pharmacy direct and indirect remuneration (DIR) going into effect in January 2024. As way of quick reminder, rather than Medicare plans and their PBMs paying pharmacies high at the point-of-sale just to collect money back from those pharmacies later via DIR (which increased patient cost sharing, among other things), the DIR policy change requires that pharmacies be paid the lowest rate at the point-of-sale (and maybe get some extra bonus money afterwards).
The obligation to pay the lowest rate at the point-of-sale made us curious what the variability in drug pricing actually looked like (such that we might analyze what “lowest” price may look like). Fortunately for us, the Centers for Medicare & Medicaid Services (CMS) makes available, on a quarterly basis, a public source of plan-level average monthly costs for formulary Part D drugs. Within this file, CMS publishes on a plan-by-plan basis what the average Medicare cost is for each prescription covered by the plan with the capability of determining anticipated patient cost sharing for each plan based upon whether the drug is dispensed at a preferred network pharmacy (if one exists) or a non-preferred network pharmacy.
What we found as we began to study this Medicare data was honestly difficult for us to initially wrap our heads around. We observed that the prices in Medicare for the same drug could be wildly different (like 100-fold difference from highest to lowest) based upon the various plans offering drug coverage benefits in Medicare. And while that alone was puzzling, imagine our surprise as we tried to bring in drug reference prices, which only further confounded us, as the highest prices were often much higher than even the highest drug reference prices out there, but the lowest drug prices were similarly lower than the lowest observed reference price.
But that aside, what really shocked us was how variable drug prices could be within the same Medicare parent organization. Medicare calls the legal entity that owns a controlling interest in the contract organization a “parent organization,” and the distinction is important because of the complicated way by which Medicare plan bids become Medicare plans. Suffice it to say, a single parent organization can have many actual Medicare plans — like hundreds.
To give an example, CVS Health is a parent organization, but it has contracts under names like SilverScript, Aetna Medicare Value Plan, Aetna Medicare Eagle, or others. Ultimately, the point we’re trying to raise here is that a parent organization has many different prices for the same drug amongst its different plans (we saw this in last week’s Money From Sick People Part IV report with insulin prices; and to be clear the phenomenon was not unique to any one parent organization).
Through the various Medicare plans, Medicare enrollees are exposed, according to this quarterly pricing file, to many different potential drug prices for the same medication, even when dispensed at the same pharmacy. This means it matters very much which plans Medicare enrollees ultimately chose to enroll in.

Figure 2
Source: Wall Street Journal, Mark Cuban Cost Plus Drug Company, 46brooklyn Research
As we attempted to reconcile all these new learnings into cohesive thoughts, the results of our early analysis ultimately culminated in a fall report with the Wall Street Journal. In Generic Drugs Should Be Cheap, but Insurers Are Charging Thousands of Dollars for Them, the Journal’s analysis found that generic drug pricing in Medicare didn’t always align with the lowest cost pharmacy options (with Mark Cuban Cost Plus Drugs as a stand-in for low pharmacy cost options). As stated in the article, “Across a selection of 20 generic drugs carried by the Cuban pharmacy, Cigna’s prices were 27.4 times higher than Cuban’s on average for the 19 drugs for which data was available. CVS’s prices were 24.2 times higher on average for 17 drugs for which data was available. UnitedHealth’s prices were 3.5 times higher than Cuban’s on average for the 19 drugs with available data.“
And while figures like that above can be shocking (especially when you can see the range of prices for a given drug), the information presented in the article was already generally known through other means. Earlier in the year, the Journal had covered the results of a study that demonstrated Cuban’s pharmacy could have saved Medicare $3.6 billion over one year (roughly 2% of gross Medicare drug spending) with generic drug purchases at Cuban’s pharmacy versus what Medicare actually incurred. These results mirrored an even earlier study that showed Costco generic drug prices producing significant savings for Medicare.
What was gained from these earlier studies and the WSJ coverage of our initial analysis were greater details regarding individual drug price disparities (not just aggregate savings). The question asked at the time of these studies, and since, is how do these pharmacies (Cuban or Costco) price their drugs more competitively than some of the largest healthcare companies in the country? Said differently, what does a start-up like Mark Cuban know about drug prices that he can get them cheaper than the big three PBMs of CVS’ Caremark, Evernorth’s Express Scripts, or UnitedHealth Group’s OptumRx are able to secure for Medicare? And why do these companies set such a wide range of different prices when Cuban only has one price for everyone?
Visualizing the variability in Medicare generic drug prices
To begin our analysis, we first need to acknowledge that Medicare covers a lot of drugs. Designing Medicare coverage is a highly regulated affair, with CMS issuing rules regarding what a formulary can reasonably look like for a Medicare prescription drug plan. There are over 4,000 drugs available for coverage based upon the listed products in the Medicare Part D dashboard (which roughly reports medications on an active ingredient basis — so “drugs” here is used loosely to represent product-lines). However, the reality is that a Medicare formulary represents tens of thousands of potential individual prescription drug products (at least on a NDC-basis). The variability in drug counts relative to NDC counts is a function of a given drug product potentially having multiple dosage forms and strengths (i.e., we might refer to the drug as Eliquis in the short-hand, but there are multiple strengths of Eliquis, like 2.5 mg tablets and 5 mg tablets, as well as six different NDCs [due to different packaging of these strengths]). Additionally, some drugs have multiple manufacturers for the same active ingredient, dosage form, and strength (i.e., the dozen or so manufacturers for metformin 500 mg tablets).
Putting that into context can be challenging, which ultimately led us to our safety blanket of a new dashboard with the intent of trying to show the variability in generic drug average plan prices in Medicare. The dashboard (below) simply shows the variability in price across plans based upon a straightforward identification of the minimum Medicare plan reported price and the maximum Medicare plan reported price according to CMS that we can identify for the reported NDCs at the listed product name level (based upon the drop down at the top of the dashboard) for generic drugs (drugs approved via abbreviated new drug applications [ANDA]). We set up the dashboard in such as way that we could track the minimum and maximum prices at the plan level but also could roll up the various plans into their respective parent organizations. The source of this information is the aforementioned Medicare Quarterly files. In so doing, we’re able to get a high-level view of how variable drug prices can be within the same plan parent organization, but the dashboard enables the ability to click down to the individual contract level and see the pricing variability at that level too. This dashboard was effectively where we started nine months ago trying to understand the Medicare quarterly files.
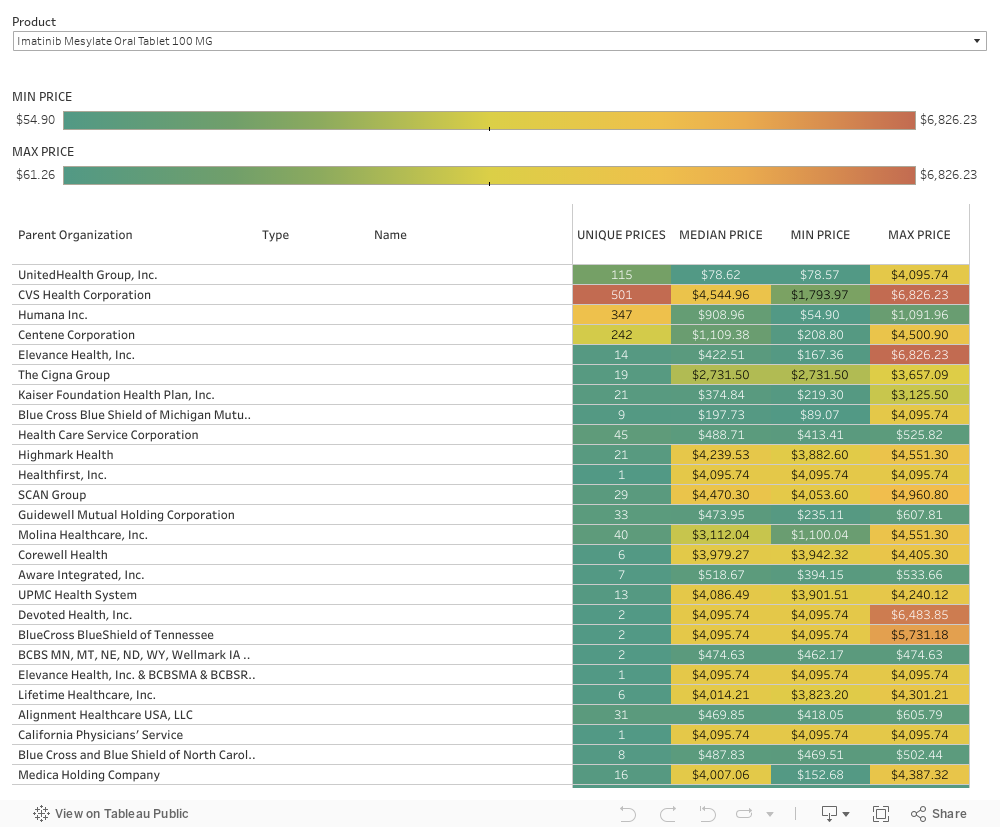
To use the dashboard above, simply select which drug/product you want to view up top and observe the range of minimum prices in Medicare across the country, as well as the range of maximum prices across the country (the top two price band green to red bars). Because of how variable prices for generic drugs can be in Medicare, we couldn’t think of a way to put into a singular visual the degree of drug variability — which led us to consider how we might discuss the information in a way that could be understood and contextualized.
Analysis: Using Mark Cuban Cost Plus Drugs to contextualize Medicare plan drug prices
As can be seen in the dashboard above, prices are highly variable for many drugs in many ways. And even variable within the same parent organization. And that variability requires closer scrutiny. But how? Well, we elected to try and start with an analysis in line with the prior Wall Street Journal reporting — namely a comparison to Mark Cuban Cost Plus Drug Company.
The goal in looking at this subset of only Cuban-available drugs in today’s analysis is that we have a pharmacy provider in Mark Cuban (someone who directly buys drugs) self-identifying a sustainable payment rate for those drugs (by virtue of Mark Cuban having complete control of the formula with which he prices his products and services). We’re relying upon that as a measure of rationality and reasonableness for the price of each drug. It may be subject to concern, as not all pharmacies are effectively mail-order pharmacies, but it represents a good directional starting point. Said differently, in light of all the recent announcements of pharmacy closures (CVS, Walgreens, Rite Aid), Mark Cuban pharmacy prices represent a view of price that a business would seem to say is sustainable and won’t lead to unsustainability.
Of the 4,000 or so drugs available for Medicare coverage, Mark Cuban Cost Plus Drugs has pricing for approximately a thousand of them (968 by our count; approximately 25% of all available drugs). These 968 drugs represent 2,500 NDCs, by our count. But that number is a little deceptive, as Cuban is covering mostly generic drugs and so his one NDC may represent a larger portion of the tens of thousands of drug products available. From a utilization standpoint, the Cuban products represent roughly 78% of the approximately 1.5 billion prescriptions filled in Medicare in 2022 (based upon Part D dashboard).
Once we had identified the Cuban-available drugs, we were interested in analyzing Cuban drug costs against the plan-specific average prices reported in the quarterly Medicare formulary files. Note, when reporting prices to CMS, Medicare uses representative NDCs, which means we had to take efforts to match the Cuban products to the like-products listed in the quarterly file. However, because both Cuban and the Medicare files are reporting drugs on the basis of NDC, the ability to join in like-products was relatively straightforward on an active ingredient-dosage form-strength basis. Once we were able to identify the selection of matching NDCs, we built a database that compared the average Mark Cuban Cost Plus Drugs price for a given product against the reported average gross price per Medicare plan (both the plan average price as well as average patient prices at preferred and non-preferred pharmacies). More specifically, the current quarterly Medicare file is titled Q1 2024 and was compared against Cuban prices pulled down at the end of June 2024 (i.e., there may be some slight timing differences between reported events, but they should be minimal).
Once a pricing table was constructed for each Medicare contract with pricing (not all Medicare plans publish public information in the quarterly files; the specific exceptions are employer and Program of All-Inclusive Care for the Elderly plans do not report into the database), we began comparing reported Medicare prices against Mark Cuban Cost Plus Drugs. There are thousands of Medicare contracts with pricing for approximately 1,000 drugs, which means our ability to present our findings on a detailed basis was a challenging endeavor. Ultimately, we elected to evaluate pricing on a proportional basis for this analysis (but are currently working on a dashboard that will enable better individual drug analyses in the future).
For today’s efforts, we are focused on simply counting how frequent the observed pricing behavior for Medicare plans was more or less costly than Mark Cuban’s price.
To start, our first analysis was conducted from the perspective of the individual drug products Cuban has at his pharmacy. If the individual drug was one where no Medicare plans were averaging a gross price above the Cuban price, then we would identify and count that drug as one where 0% of plan sponsors’ gross spending was higher than Cuban’s price for that drug. Alternatively, if the drug was one where all plan sponsors were incurring an average gross cost higher than Cuban’s, we would record that as a product where 100% of plan sponsors were more expensive than Cuban. If eight out of every 10 plans had pricing cheaper than Cuban’s, we recorded it as a plan where Cuban was cheaper only 20% of the time. We graphed our results in the figure below. Note, as we indicated in our insulin report, drug prices in the Medicare quarterly file are reported as both the price for a 30-day supply and the price for a 90-day supply, and those rates can be different within the same plan for the same drug. As a result, we have to present the information for each days’ supply separately.

Figure 3
Source: 46brooklyn Research, Mark Cuban Cost Plus Drug Company, CMS Quarterly Medicare Pricing Files
The proper way to interpret the figure above is, as way of example, there were 446 drugs (out of the 2,500 that Cuban offered) where the Cuban price offered effectively no savings to Medicare (as the 446 value above is in the 0-to-10% range, meaning more than nine out of 10 plans already priced the drug at or below the Cuban price). Again, we think that this initial finding is perhaps not surprising when we consider some recent studies regarding Cuban price relative to insurance copays. In order for it to be the case that only one out of 10 people would benefit from lower out-of-pocket costs with Mark Cuban (the approximate finding of the patient-level savings study just linked), it would appear likely that the average cost for many of Cuban’s drugs would be cheaper within Medicare insurance than outside of it (i.e., purchased through Cuban directly, outside their plan). Conversely, there were 538 drugs (out of the 2,500 that Cuban offers) where nine or more out of every 10 plans were pricing the drug in such as way as to be more expensive than the Cuban price (which will warrant closer scrutiny later in this report).
If this seems a little complicated, we’re providing a link to the individual drug results here such that you can review how the above figure was generated on a more product-by-product basis. If you look at that workbook, you’ll see lisinopril 5 mg tablets as one where we do not expect Cuban to be of much savings. This makes sense based upon what we generally know about lisinopril pricing in Medicare. If you look at the price of lisinopril back in 2022 (via the Part D Dashboard), the average cost per prescription in Medicare was roughly $8 (for roughly 80 pills). Cuban is seeking approximately $11 per lisinopril fill (for 90 pills) according to the CostPlusDrugs website ($6.80 in drug dispensing costs and $5 to ship the product) [Note: we’re making sure the units match, but since we’re linking to the various websites we’re reporting the units as they exist on those website, not based upon the conversion math we’ve done in the dashboard]. As a result, seeing lisinopril show up as a drug not likely to be associated with savings through Mark Cuban is an expected result (and represents one of our attempts to validate the data). Conversely, you’ll see other familiar drugs like imatinib mesylate and everolimus where Cuban is going to deliver savings relative to the prevailing Medicare plan rates almost all of the time.
While the above figure analyzes gross Medicare drug plan prices against Cuban prices, the following Figures 4 & 5 perform the same style of analysis solely for the anticipated patient cost-sharing amounts to obtain the drugs (so just the patient out-of-pocket portion of the drug’s total tab). Note that cost-sharing amounts are differentiated based upon whether the drug was to be dispensed at a preferred or non-preferred network pharmacy under the plan. As not all plans have preferred network pharmacies, the interpretation of these results can get a little tricky, as the denominator between the two comparisons is not the same. For example, we’re only comparing the proportion of drugs where Cuban is cheaper than the preferred cost-sharing amount for the subset of plans with preferred pharmacy networks. Those plans will generally also have pricing for non-preferred networks (but not all non-preferred network pricing will have a corresponding preferred network price). We know — Medicare is confusing — but just know that those differences are not the focus of today’s report. But we have to explain them such that you understand why the below figures may not seem to exactly jive with one another.

Figure 4
Source: 46brooklyn Research, Mark Cuban Cost Plus Drug Company, CMS Quarterly Medicare Pricing Files

Figure 5
Source: 46brooklyn Research, Mark Cuban Cost Plus Drug Company, CMS Quarterly Medicare Pricing Files
Again, the figures above further reinforce the findings of the most recent study regarding Mark Cuban drug costs relative to solely the patient cost-sharing amounts with insurance, but before we can start to unpack these findings further, let’s quickly show you the results for the 90-day pricing analysis in Figure 6. Again, Medicare plans can report different unit prices for drugs on the basis of the drug being dispensed as a 30-day or 90-day supply (another way the same drug, at the same pharmacy, can have potentially different costs). For completeness sake, we’re showing the 90-day prices, and to save some space, we’re rolling the figures all together (as hopefully now they’re becoming a little more digestible).

Figure 6
Source: 46brooklyn Research, Mark Cuban Cost Plus Drug Company, CMS Quarterly Medicare Pricing Files
So while the above figures perhaps represent a further directional validation of the findings of the earlier mentioned study (but not necessarily a proper contextualization of those findings), we are not quite done making comparisons of Medicare drug prices against Mark Cuban Cost Plus Drugs. You see, while the above represents the perspective of price for each drug, it doesn’t give us much of a sense of the value of the plan benefit within each contract we’re assessing. Meaning, sure, sometimes Cuban’s prices are more expensive than a majority of Part D plans, and sometimes he’s cheaper than a majority of plans, but the net value proposition of either of these views doesn’t consider the premium cost that had to be paid to secure the lower cost savings with Medicare drug insurance to begin with (which we think is important considering Medicare charges a monthly fee to get coverage, whereas Cuban does not — so it isn’t an apple-to-apples comparison when Medicare cost sharing (or any cost sharing) amounts are compared to the Cuban price).
As a result, we wanted to also understand the inverse relationship — namely, were there certain plans where, for the majority of drugs offered by Cuban, their pricing was higher than Cuban. While the above figures showed us what is happening on a drug basis across plans, this is trying to show us what is happening by a plan basis across the group of drugs. To do this, we looked at each Medicare plan, and for the drug prices that each plan has within the Cuban-available subset, we assessed across the collection of those Cuban drugs what proportion of plan prices were more or less expensive than Cuban. Now, for this analysis we had to not only break up the plans by their 30-day and 90-day prices, but we also had to analyze the prices across the stand-alone Prescription Drug Plans (PDPs) but also the Medicare Advantage Drug Plans (MA-PDP), as they have different premium dynamics around getting prescription drug insurance.

Figure 7
Source: 46brooklyn Research, Mark Cuban Cost Plus Drug Company, CMS Quarterly Medicare Pricing Files

Figure 8
Source: 46brooklyn Research, Mark Cuban Cost Plus Drug Company, CMS Quarterly Medicare Pricing Files

Figure 9
Source: 46brooklyn Research, Mark Cuban Cost Plus Drug Company, CMS Quarterly Medicare Pricing Files

Figure 10
Source: 46brooklyn Research, Mark Cuban Cost Plus Drug Company, CMS Quarterly Medicare Pricing Files
Ultimately, we were able to identify that yes, there are plans out there where four out of 10 times, the typical cost of the drug for the plan sponsor was higher than the Mark Cuban price. This is significant considering the size, leverage, and sophistication of Part D plans relative to the upstart nature of Cost Plus Drugs. Which led us to look at the largest Medicare plans individually. They should have the greatest size, leverage, and sophistication, right?
As shown in Figure 11 below, the variability in experience of Medicare drug prices for Cuban-available products essentially mirrored the figures above. Some plans have very few drugs where Cuban represents a deal on the drug cost alone, whereas others may have roughly a third of products offered by Cuban where savings exists. And yes, we’re cherry picking plans based upon the list of top plans/PBMs that the FTC identified in their July report (but these are also some of the largest parent organizations in Medicare based upon enrollment).
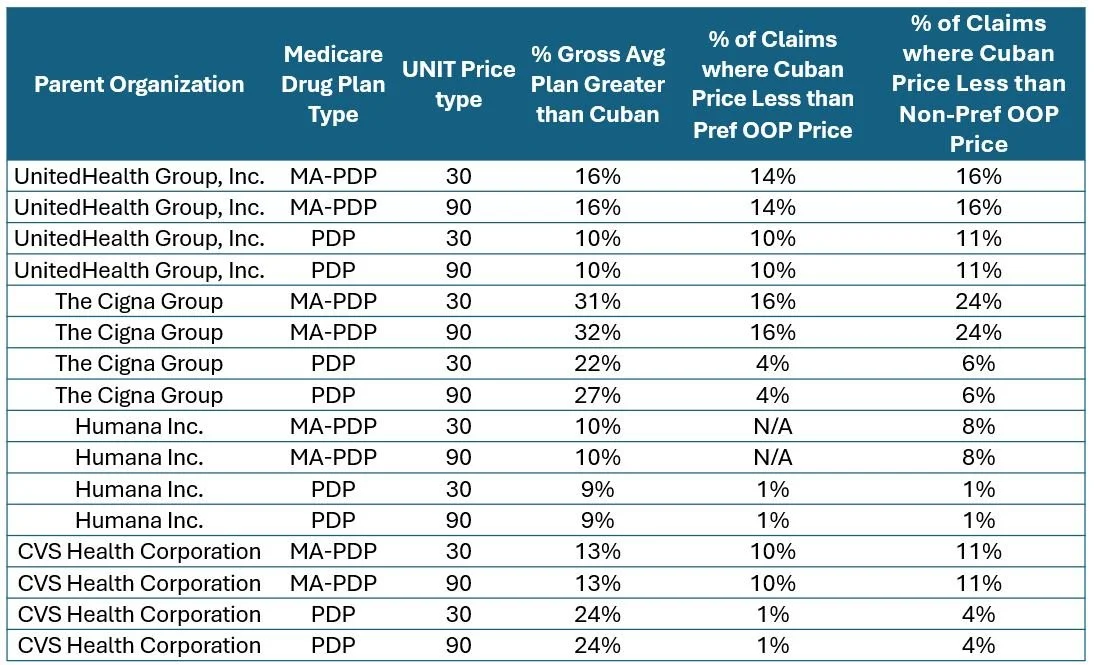
Figure 11
Source: 46brooklyn Research, Mark Cuban Cost Plus Drug Company, CMS Quarterly Medicare Pricing Files
Taken together, the above figures led us to do two additional investigations.
First, if you go back to the perspective of the individual drugs, there were a few stand-outs. Discussing dozens or hundreds of drugs in a short-ish report is difficult (hence why we provided links to the data and the dashboard of Medicare prices), so we selected those that seemed to represent drugs that were never likely to have “reasonable” plan prices in Medicare (at least as measured by Cuban’s price) across the various analyses thus far performed. In Figure 12 below, we identify some of these drugs based upon what the data is showing us — and the results are honestly not surprising, considering that our prior research has revealed a host of pricing issues with the these frequent flyer upcharges.

Figure 12
Source: 46brooklyn Research, Mark Cuban Cost Plus Drug Company, CMS Quarterly Medicare Pricing Files
In the table above, you can see that basically no Medicare plan is likely to offer a reasonable price on imatinib or abiraterone or a number of other drugs (refer to our previously linked per-drug Excel file for more examples). The average Medicare plan gross price for imatinib remains above $1,000 despite Cuban being willing to sell the product for $30. We imagine this is why Cuban prices have found a lot of fans in certain groups online. Imagine if your blood cancer treatment cost $1,000 on your first month of treatment (because you went through your insurer) only to discover that someone else would have sold you the same drug for $30. We think you’d be pretty miffed. Conversely, if you had prostate cancer and saw that the range of abiraterone prices was from $106.73 to $8,793.65 in Medicare, with again the largest organizations setting hundreds of unique prices, you’d probably be pretty upset to learn that the average Medicare price of roughly $1,800 was approximately 10-times the amount that Cuban’s pharmacy (or Costco pharmacy as yet another alternative) would sell you that medication for. Or take the cancer drug everolimus, which Mark Cuban sells for just over $400 per prescription. The average Medicare gross price for the same drug is more than $5,600 per prescription.
Apparently, this is a difficult situation for PBMs themselves to explain, at least according to some of the insights gleaned from the July FTC report, where in talking about imatinib mesylate pricing, an executive from a PBM parent organization was quoted as saying the following:
“[Y]ou can get the drug [imatinib mesylate] at a non-preferred pharmacy (Costco) for $97, at Walgreens (preferred) for $9000, and at preferred home delivery for $19,200. CMS expects that plans that offer preferred pharmacy constructs have lower pricing in the preferred channel. Compounding the challenge/optics is the fact that we’ve created plan designs to aggressively steer customers to home delivery where the drug cost is ~200 times higher. The optics are not good and must be addressed.”
And yet, digging deeper into some of these drugs, we see that whether we look at the average price, the minimum price, or the maximum price across all the Medicare plans, no one seems to want to provide the above drugs at reasonable prices (at least ‘reasonable’ as measured by Cuban’s singular price).
To that end, we performed the second part of our analysis, which was to show the prices standardized between the largest parent organizations in Medicare on a minimum and maximum basis relative to the singular Mark Cuban Cost Plus Drugs price point. We selected a few, but more exist (see above). These may be cherry-picked examples, but perhaps the observation is, how were these cherries planted in the first place.

Figure 13
Source: 46brooklyn Research, Mark Cuban Cost Plus Drug Company, CMS Quarterly Medicare Pricing Files

Figure 14
Source: 46brooklyn Research, Mark Cuban Cost Plus Drug Company, CMS Quarterly Medicare Pricing Files

Figure 15
Source: 46brooklyn Research, Mark Cuban Cost Plus Drug Company, CMS Quarterly Medicare Pricing Files
If you stare at the above numbers long enough, we can understand why one might begin to lose an appreciation for the sheer scale of the price ranges of these medicines.
For example, across its parent organization’s plans, UnitedHealth Group set 203 different prices for imatinib mesylate, with the minimum price being $71.70 per prescription while the maximum price is $4,919.51 per prescription. Across its parent organization’s plans, Cigna set 19 different prices, with the minimum price being $3,279.90 per prescription while the maximum price is $4,385.78 per prescription. Across its parent organization’s plans, CVS set a staggering 597 different prices, with the minimum being $2,658.86 while the maximum price is $8,199.17. For this same drug, Costco and Mark Cuban sell for less than $40 per prescription (at one price point).
In the case of CVS Health, despite their massive size, they are, at times, charging seniors and the Medicare program more than 20,000% more than Costco and Mark Cuban for this cancer drug. Further, the lowest of their 597 prices is still more than 66 times higher than these other smaller pharmacy companies.
And before we get accused of just focusing on negative examples only, let’s return to some of the drugs where Cuban didn’t seem of value. Recall that we earlier identified lisinopril 5 mg as a drug where no plans were likely to be charging more for the drug than Cuban. Well, it turns out that may not be entirely true — rather our perception of the issue appears to have been clouded by effectively how many decimal places we carried out in our observation.
When we looked at minimum and maximum average price per Medicare plan within the quarterly files, imagine our surprise when we found maximum lisinopril prices above the Cuban price. We had previously identified no plans having an out of whack lisinopril price, so how come the details were disagreeing with us? Said differently, how is a plan out there pricing lisinopril 5 mg in excess of $20 per month when the data showed 100% of plans were pricing it below Cuban’s (~$12)?
The answer goes back to all the plan choices Medicare offers. Across the nation, there are more than 3,000 prescription drug plan options, which means that in order for us to observe the drug as having irregular plan pricing, it needs to reach a threshold where at least 30 plans or more have the product higher than Cuban’s price for it to show up as just 1% of plans having a higher price than Cuban (in our count of plans previously). There appear to be less than 30 plans that would charge high lisinopril prices, and yet, there are plans that may try to have you incur a gross cost above $20 (which is above the WAC for 90 lisinopril of nearly (but not all) every listed NDC in our drug reference compendia). As a reminder, pharmacy DIR is supposedly gone now in 2024, so trying to explain why these generic drug costs are high can be a little bit difficult.
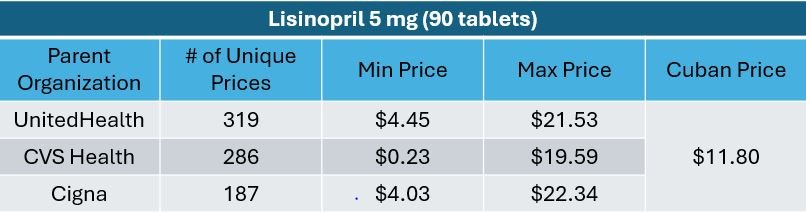
Figure 16
Source: 46brooklyn Research, Mark Cuban Cost Plus Drug Company, CMS Quarterly Medicare Pricing Files
This example is illuminating in so many ways and brings us back to our earlier mention regarding premiums. It shows that while yes, some drugs can really take an individual to the cleaners in regards to excess charges, and others can accrue value across a thousand cuts. Furthermore, it is demonstrative how one price can become many prices with various perceptions of drug cost savings.
One of the plans that has high average lisinopril plan prices listed by Medicare (at least based upon the average gross cost reported in the quarterly Medicare files) is the 2024 AARP Medicare Rx Walgreens from UHC (PDP). This plan has a monthly premium of approximately $80 (above the typical premium). Now fortunately, lisinopril is a preferred medication within that plan with a flat $2 copay, but undoubtedly part of the reason why the copay is so low is because the premium is so high. Which brings us back to the whole reason we started this report.
When we consider patient drug cost sharing with insurance, we should consider the investment of premium dollars that are producing the end cost sharing amount. When a simple drug like lisinopril can have hundreds of different prices just within Medicare plan offerings (being as cheap as $0.23 — less than a stick of gum — to more than $20), we do no one any favors to say, “the value of your insurance is clearly of benefit” when we don’t adequately contextualize that the $2 copay required an $80 premium (hence why perhaps prior reports focused on gross prices; to not discredit the impact patient cost sharing has on perceptions of drug prices).
The reality is drug prices are not always experienced in consistent, rational ways. We know from the Rutledge v PCMA decision that PBMs do not typically price drugs (at least generic drugs) in relation to their acquisition costs. But the many disparate PBM-set drug prices leaves us grasping at straws for what they’re actually doing with the pricing power they’ve been granted.
What even is the price of a drug?
If you’ve made it this far into the report, you’re likely asking what the big takeaways are. Is it that Mark Cuban Cost Plus Drugs is saving money on drugs compared to Medicare plans? Is it that he isn’t saving money? While these are good insights to glean, we’d like to draw your attention to what we feel is perhaps the most stunning data in this study. We think it starts with a simple realization that drug prices in Medicare are variable (by factors of up to 100x from min to max). If you go digging in the dashboard, you’ll see there are contracts out there that have just one price per a given drug, but those plans are small (and the exception). Most plans have dozens of prices, and most of the plan parent organizations (particularly the largest) have hundreds of prices. That is concerning given what we know about generic drug prices.
We know that the origin of generic drug prices are not manufacturer list prices, but PBM maximum allowable cost (MAC) lists. PBM MAC lists are the only way you can get hundreds of different prices for the same drug (no drug reference price will give you that kind of variability). Furthermore, we know MAC price lists are the predominant way that generic drug prices arise at the pharmacy counter. However, what is claimed about MAC pricing doesn’t seem to match what the data is showing us. According to industry, “MAC pricing is designed to promote competitive pricing for pharmacies as an incentive for them to purchase less costly generic drugs available in the market, regardless of the manufacturer’s list price.”
If you look at the prices in the figures directly above for lisinopril, imatinib, abirariterone, and tetrabinazine, you can see that there are pharmacy organizations like Mark Cuban Cost Plus Drugs who are willing to set one drug price across the country, and yet, PBMs are not setting one price, and often are setting a variety of prices with what can be a 100-fold difference from minimum to maximum. What possible rationale incentive can pharmacy providers discern from such pricing? We are unsure what market, pharmacy not withstanding, would be able to discern what product to purchase for the lowest price when the experience is potentially so wide ranging on a month-by-month basis. Said differently, how is pharmacy to follow an incentive that is so difficult to discern?
We also know that Mark Cuban alone cannot help us fully understand Medicare generic drug pricing irregularities. As an online, mail-order pharmacy and quasi pharmacy benefits solution, they’re not currently offering controlled substances, so when outside of Cuban-available drugs in the Medicare program, we see ranges for needed substance abuse medications like burprenorphine-naloxone (generic Suboxone) that sometimes value the treatment at less than a $1 whereas other times valuing the treatment at over $300, we question what incentive is really being offered to pharmacy providers and further, what the disparate prices mean for seniors in the program.

We have seen within our home state of Ohio how drug pricing distortions can lead to access issues when pharmacy providers perceive that the price of the medication offered through insurance doesn’t match the price to operate their business. And when the prices yielded by PBMs can be so all-over-the-map, beyond the threats of pharmacies choosing not to inventory certain products based on financial pressures, are the threats that patients may choose not to purchase critical medicines when their cost-sharing could be derived from the gross prices that we see in the Medicare data. And since some Medicare plans are regional in nature, might this range of prices yield inequitable pricing experiences from one state to another despite getting benefits under the same plan or same parent organization?
The facts are that PBMs have assumed the role of drug pricing experts within our drug supply chain. Whether intentional or not, it is increasingly clear that one of, if not the, primary value proposition of the PBM to the drug supply chain is acting as the entity that knows what a drug’s actual price really is. If there was a recognized and prevailing drug price outside of PBMs, it would be theoretically easier for plans and pharmacies to come together and contract for drug costs around that recognized prevailing drug price.
But although things like national average drug acquisition cost (NADAC) exist, the payer market hasn’t moved away from subjective pricing and towards more cost-based approaches, and so the concept of “the price” of a drug remains elusive. Which means that PBMs alone remain the sole entity that can see the rebates offered by drug manufacturers, the prices pharmacy providers are willing to take via their network guarantees (both at the point-of-sale and after reconciliation), and the cost health plans are willing to incur to secure prescription drug benefits for their covered lives. The PBMs are the only one who has a fully contextualized drug price.
And yet, one wonders how organizations so dedicated to lowering drug costs (PBMs claim to be the only organizations working to lower costs) can be creating such disparities in drug pricing. As their trade group PCMA has professed, “In Medicare Part D, pharmacy benefit managers, PBMs, negotiate directly with drug manufacturers and pharmacies to provide beneficiaries with the lowest possible prescription drug costs and the highest quality pharmacy experience.” One wonders how the Medicare plan/PBM parent organizations, with insights into all their contracts various pharmacy prices, can square such statements with the data. How did they decide who gets the maximum price — and how is that price aligned with securing the lowest possible drug cost? How does setting such variable costs square with incentivizing pharmacies to purchase more competitively? How can PBMs profess that only drug companies set prices when those same PBMs can yield 600 different prices for the same medicine? And how can one proclaim working to achieve the lowest cost when only one price (out of those 600 or so different prices) can, in fact, be the lowest?
In short, with all the attention on drug prices, we find ourselves asking, just who do the drug prices actually work for?
