
Medicare’s addiction to disconnected drug prices
Prescription drug prices in the U.S. receive a lot of attention. Some of it is academic, such as comparisons amongst how we measure drug price trends or determine a drug’s price within a country. Other times, interest in drug pricing arises out of efforts to report newsworthy events, such as the implementation of drug price negotiation (or price setting, depending on your perspective) within the Inflation Reduction Act or to identify that a newly launched medication overtakes the previous as the most expensive medication ever to hit U.S. pharmacy shelves. Undoubtedly, 46brooklyn would itself not exist but for the interest that exists within societal efforts to understand drug prices. And yet, for all the attention drug prices receive, there appears to be a great deal that we don’t know about drug prices within the United States.
Of course, just the mere idea that there is so much effort invested in order to understand drug pricing suggests that the default premise that drug pricing is not understood.
Today, in our latest exercise in bridging the gap between misunderstanding and understanding the convoluted U.S. drug pricing system, we dig through more Medicare Part D data to illustrate that the default premise that drug pricing is not understood is not necessarily solely the fault of the layperson. Instead, what we see is how disparate and disconnected drug costs yielded by Part D health plans can result in a casino-like experience for seniors and the federal government.
Beating our heads against the wall, hoping to make a door
Arguably one of the most famous images within U.S. healthcare from Drug Channels Institute seeks to show us how the U.S. Pharmacy Distribution and Reimbursement system for patient-administered outpatient drugs actually works:
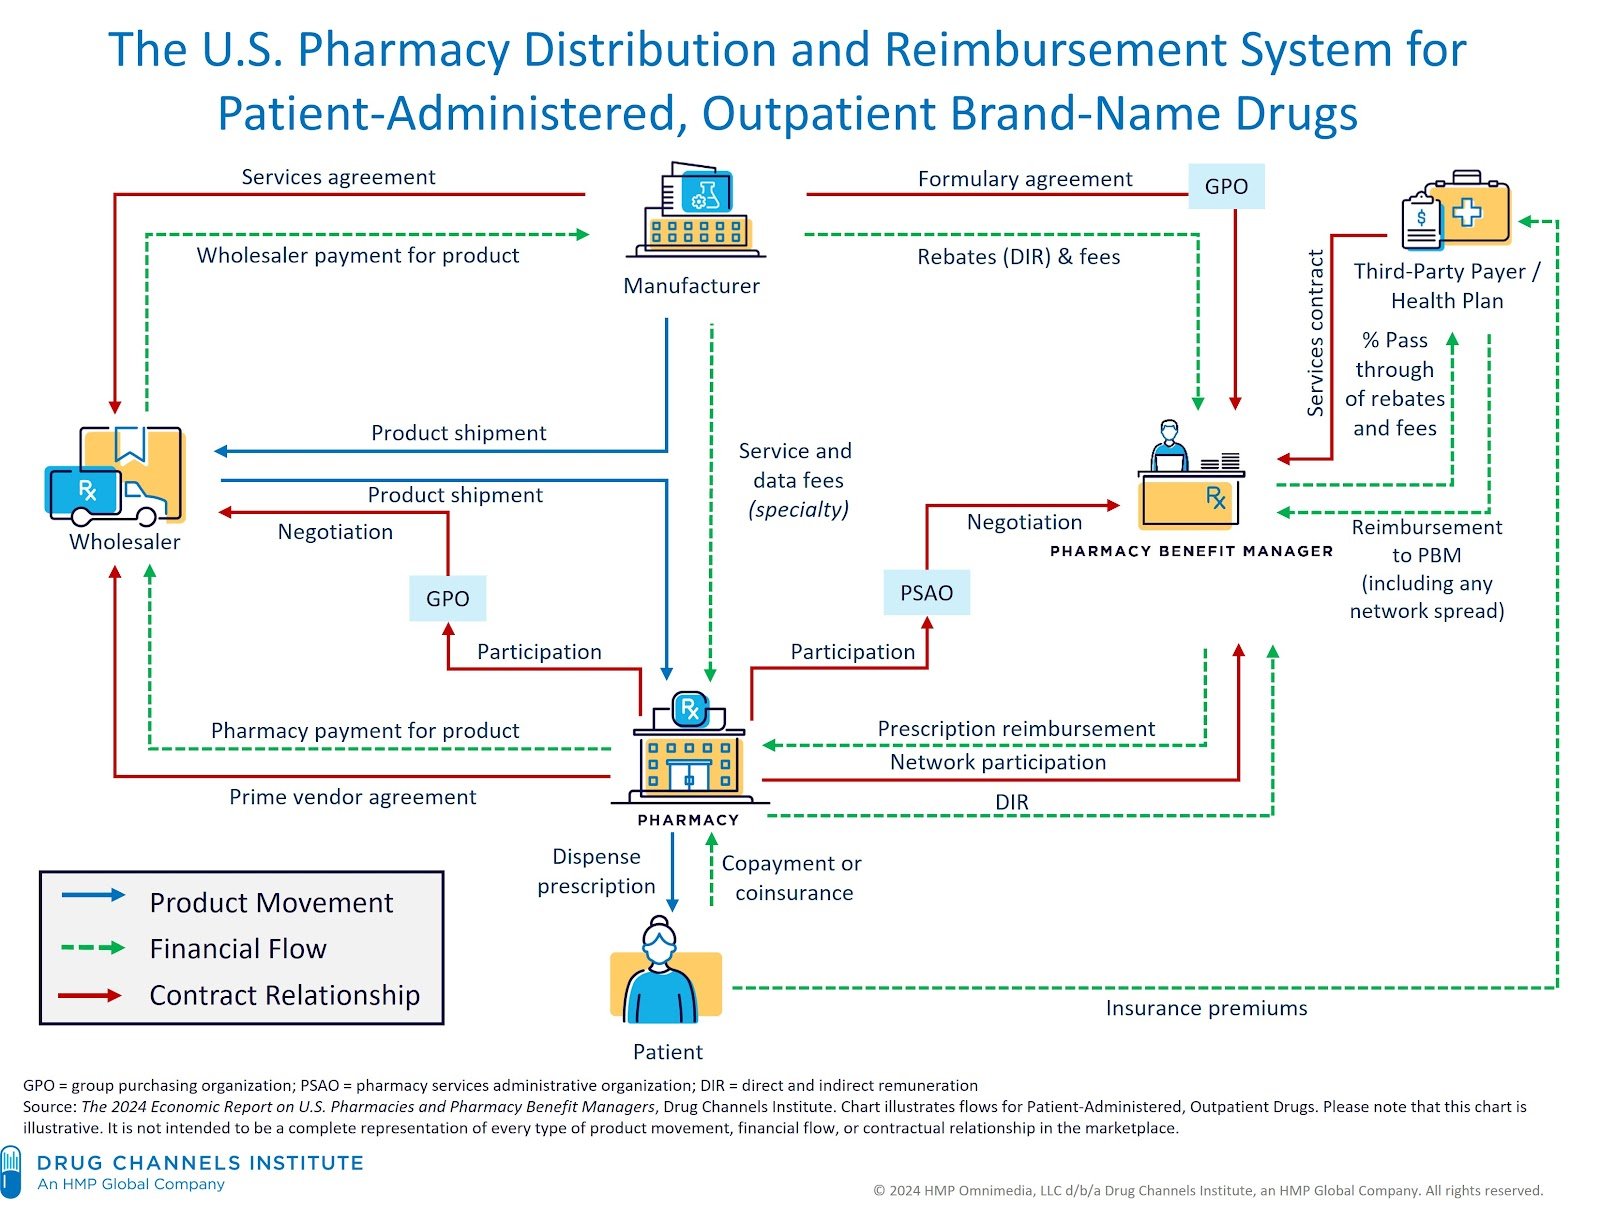
Figure 1
Source: Drug Channels Institute
And despite the best efforts of the visualization above to help us understand our complex drug distribution channel in as straightforward a way as possible, when we take this image and try to overlay our understanding of drug prices over top of it, what we come away with is an appreciation for how little information we have regarding a drug’s actual cost for the people buying it (be they patients or third party payers; i.e., the right and bottom of this chart).

Figure 2
Source: Drug Channels Institute with added price benchmark graffiti from 46brooklyn Research
If you really study the modified image above, we have a bunch of different ways to contextualize manufacturer prices, a few more ways to contextualize prices as experienced by pharmacy purchases, and almost no prices to understand patient cost experiences (bottom of image) or health plan costs for drugs (right side of image). We remind ourselves of these facts before we begin today because it is important to recognize that when there are a dozen different prices for something, there is effectively no real price for that something. Or perhaps saying it differently, more important than any listed drug pricing benchmark is what we’re actually paying for drugs – which may, or may not, be related to the actual price of the drug in the first place.
Now, this idea that a drug price ≠ drug paid amount is a point we’ve raised before in past writings, but is not a point that we think is generally accepted by those whose job it is to talk about drug prices. For many years, the narrative has been that drug manufacturers, and drug manufacturers alone, set the price of a medication. Pharmacy benefit managers (PBMs), in particular, have been banging this drum a lot as of late. If this idea that drug companies are solely responsible for drug pricing reality, it seems unlikely that one would spend $2,000+ on imatinib or $4,000+ on abiraterone prescriptions when a pharmacy can buy those drugs for approximately $50 or $100, respectively. And while we are flush with examples of one drug having many different paid amounts, this reality that drug price ≠ drug paid has not seemed to permeate the collective understanding of drug pricing.
So let’s start by taking a step back. From our perspective the complexity of the drug supply chain has been built, in part, by taking drug prices and stuffing extra costs within them. When we buy and sell drugs, we generally have a drug’s price in mind, but we have not seemed to prioritize ensuring that the cost we pay for the drug is a separate line item from the other costs incurred to dispense drug (such as transporting drugs from manufacturers to pharmacy providers, pharmacy providers dispensing those drugs to patients, etc.). For example, a typical group seeking prescription drug insurance will often receive offers from an insurer/PBM to recognize drug costs as some discount to average wholesale price (AWP) plus a de minimis dispensing fee (see Figure 3 below for an example; some of our own emphasis has been added).

Figure 3
Source: San Juan County Board of Commissioners
We know that pharmacies are a business and have overhead costs. We know those overhead costs exceed $1 (i.e., the dispensing fees offered above) and, in fact, are approximately $10-12 per prescription today. Yet, if we are not recognizing these costs within the contracts (see above, where pharmacy dispensing fees from PBMs are essentially non-existent), then are we not acknowledging that cramped into that AWP-based discount for the cost of the drug is going to be some amount of money to cover the pharmacy’s operating cost and make enough of a profit that sustains their business? Or saying it differently, what does such an approach tell us about any other costs that could stuffed be into the the cost of the drug, like PBM compensation or broker compensation?
For the removal of doubt, let us rudely answer our own questions and state emphatically that it is not possible to claim that drug costs are solely a function of the drug manufacturer, and the drug manufacturer alone, when the drug pricing contracts that govern cost realities appear to so obviously be designed to stuff other costs within the price paid for drugs. On paper, there appears to be a drug cost tied to a drug price, but the reality of what we’re using seems a direct acknowledgement that the drug price is paying for other non-drug cost things. Said differently, the component parts of drug payment are themselves disconnected from reality and so we cannot assume that the reality of a drug’s list price is tied to the price we will pay for medications. Whether you’re the party signing the contract or offering up to the plan sponsor to sign, we know – and have known for two decades – that AWP does not represent a real drug costs. Therefore, how rational is it to complain about drug costs when costs are being derived by using drug prices that don’t represent any real drug cost in the system?
While we know that pharmacies have $10+ per prescription in overhead costs, the way that groups purchase prescription drug benefits has yet to actually acknowledge these facts within the very contracts they use to pay for drugs (see dispensing fees above; less than $1 in all instances). Putting the component prices of these contracts into a different perspective, the formula we’re using to recognize drug costs is one reliant upon an irrational, inflated drug price (i.e., AWP) plus a knowingly unreasonably low dispensing fee (<$1 vs. $10+). In such a light, it strikes us as farcical to think that such a formula, like those that pervade drug pricing contracts, could ever produce a system of rational prices, and yet it is the way that millions of prescriptions in the United States are paid for every year (and for much of the past decades). The disconnected nature of such a payment paradigm becomes apparent when viewed through the lens of its component parts, and the irrationality of a thing is not an argument against its existence. Which brings us to our latest attempt to seek to explain why what we pay for drugs is so often disconnected to what the price of the drug is to begin with – and why the price-setting behaviors of drug channel intermediaries can at times be even more consequential to the incurred end cost for a medicine than the actions of any other market participant.
Lots and lots of data
Check out our previous looks at Medicare’s Quarterly Prescription Drug Plan Formulary, Pharmacy Network, and Pricing Information files:
It is no secret that we have recently become enamored by Medicare’s Quarterly Prescription Drug Plan Formulary, Pharmacy Network, and Pricing Information files. First and foremost, Medicare is the program responsible for the most drug purchases in this country (coming in at over $200 billion in gross drug purchases in 2022). Second, Medicare recognizes drug costs not by setting a price per drug (as say other countries approach drug pricing), but through the efforts of private health insurers and their pharmacy benefit managers (PBMs) who each set and approach drug pricing in different ways. We can see this within this wonderful Medicare dataset, because the pricing information contained within these files is not just a drug and its price, but rather, the data contains the “plan level average monthly costs for formulary Part D drugs.“
The way Medicare is structured is that a single organization may itself offer many different types of Medicare plans (Medicare has long recognized the number of choices of health plans offered to patients), but rather than these files containing one drug price for each plan under a given organization, what we see is that drug prices vary not just from one organization to the next, but even within the different plans of a single organization. What’s more, price can vary for the same plan (i.e., national plan) based on geographical region. For example, the price of a generic drug in Aetna’s SilverScript plan may be different in Wyoming than Florida. In summary, parent organizations may offer different plans from which they have variable prices between those plans, but they also have variable prices within the same plan based upon geographical region.
There are not a lot of public sources of information that delineate what health plans pay pharmacies for prescription drugs (see Figure 2 previously). We know this type of information is important and would be highly informative as a way to better understanding the flow of dollars in the drug channel. We know this in part because the Transparency in Coverage rule was passed and required health insurance issuers and group health plans to disclose information about prescription drug prices on their public websites – but that rule has yet to be fully actualized/enforced, so we’re more or less left with the Medicare information as a window into the various ways of how insurers contract for drug prices. And so if we want to understand how paying for drugs via contracts plays out within the U.S. Pharmacy Distribution and Reimbursement System, then having a focus on Medicare will help us tell as complete of a story as we may otherwise be able to tell based upon present data sources.
Show me the incentive and I’ll show you the outcome
As we discussed in our May drug pricing review, pharmacy providers buy prescription drug inventory from wholesalers in order to then sell that inventory to customers based on their healthcare needs. Because of the nature of the business (as we previously described), pharmacies can't simply dispense more of the most profitable drugs (i.e., our expectations of a business to maximize the most profitable aspects of one’s business are perhaps not as practical to pharmacies as they are to other businesses). As a result, pharmacies aim to minimize financial losses by avoiding medications that result in underpayments. As we called back to in our May report, we have real-world evidence to back this up, as in 2018 (as reported on by the Columbus Dispatch), Ohio pharmacies were de-stocking generic Suboxone prescriptions due to low PBM reimbursement rates for those drugs.
Generic Suboxone (buprenorphine-naloxone) is a fascinating drug that has received a great deal of attention over the years. Originally discovered as far back as the 1960s, Suboxone and its subsequent generics have become a cornerstone of efforts to combat opioid use disorder (OUD) within the U.S. While not the first drug to be a breakthrough in treating OUD (see methadone), the buprenorphine-like products were the first to be more readily available and mainstream through the passage of the Children’s Health Act of 2000 (with Title XXXV of the Act creating a “Waiver Authority for Physicians Who Dispense or Prescribe Certain Narcotic Drugs for Maintenance Treatment or Detoxification Treatment of Opioid-Dependent Patients”). Because we have seen via past reporting how payment for a drug can influence real-world access to the drug with generic Suboxone, it seems as reasonable as any of a drug to focus on for our latest attempt to “follow the money.”
To be clear, access to Suboxone (and its generics) has been often challenging, even before the 2018 Columbus Dispatch story highlighting its disappearance from Ohio pharmacy shelves. Part of the historical access issues were undoubtedly related to the brand manufacturer price point (even if there were rebates available for the medication), but again, a focus on access through the narrow lens of price will miss other key aspects of what transpired with this drug over time. For example, it has also been known that access to Suboxone (and its generic) has been impeded as a function of benefit design choices that require prior authorization or other utilization controls that restrict sales of the medication to those who may have otherwise purchased the drug. And while Suboxone is also semi-famous for the manufacturer efforts to product-hop from the tablet formulation of the medication to the film (in what appeared to be efforts to limit how much generic was dispensed relative to the brand), the introduction of generics has helped materially lower cost barriers to access through significant price deflation (based on surveyed pharmacy acquisition costs; see NADAC chart in Figure 4 below).

Figure 4
Source: Data.Medicaid.gov, 46brooklyn Research NADAC Drug Pricing Dashboard
As can be seen above, the price of the generic forms of Suboxone are a fraction of what they were when they initially launched (although, in the wacky world of drug pricing the brand price has continued to climb despite increased competition). And yet, despite all the attention that Suboxone has garnered over the years and all the cost deflation highlighted above, Suboxone is yet another important example of how subjective approaches to the pricing of medicines by drug channel intermediaries can cascade into a series of issues that go far beyond traditional perceptions of access challenges.
First, let us acknowledge that any discussion about Suboxone (buprenorphine-naloxone) today will need to be framed around the generic, as the brand is hardly dispensed at this point. To that end, whether we are discussing the film or the tablet versions, the medication is cheaper now than it has arguably ever been. Since July 2021, the going rate for pharmacies to acquire buprenorphine-naloxone film has decreased from $3.78 a film to $2.75 a film (Figure 4 above, a 27% decrease), whereas the tablet has decreased from $1.19 a pill to $0.93 a pill (Figure 4 above, a 22% decrease). Relative to the current brand price of $8.62 a film (at national average drug acquisition cost, or NADAC; recall that the manufacturer stopped making the tablet, so there is no tablet price point comparison), both the film and the tablet represent a savings of 68% and 89% respectively to purchasing the brand drug for the pharmacy.
Generic drugs are generally where pharmacies derive the majority of their profit, and when one considers that the brand has a many-fold increase in carrying costs to the business of pharmacy relative to the cheaper generics, it is not hard to see how these prices partly influence why generics get dispensed more than the branded Suboxone product today.
One would think that it would be relatively straightforward for payers to recognize the costs associated with generic Suboxone treatment based upon the “oneness” of NADAC drug prices. However, we know that contracts used to pay for drugs generally don’t rely upon NADAC to recognize the drug costs (they rely upon AWP) and we also know that the data doesn’t support the idea of “one drug cost paid” for any given drug. For example, if you review our Medicaid Markup Galaxies dashboard – which tracks the costs that state Medicaid programs incur relative to the underlying acquisition costs of medicines – you can observe that Medicaid managed care programs do not recognize drug costs associated with generic Suboxone in any way that would appear uniform (despite being in a program [Medicaid] very familiar with NADAC-based costs). As a reminder, our Medicaid Markup Galaxies dashboard (screenshot below in Figures 5 & 6 for generic Suboxone tablets and films, respectively) displays the difference between what the state Medicaid reimbursement for generic Suboxone was in relation to NADAC at the time for each drug, and groups them based upon whether the amount above NADAC was "In-Range” (between $5 and $15 per prescription above NADAC; which covers basically every state Medicaid program’s actual dispensing fee [e.g., Alaska’s “Off the Road” system dispensing fee not within this range]), “Low Cost” (less than $5 above NADAC; or instances where the pharmacy is likely to lose money selling the drug), or “High Cost” (above $15 per prescription; instances where the pharmacy is likely to make over their dispensing costs).
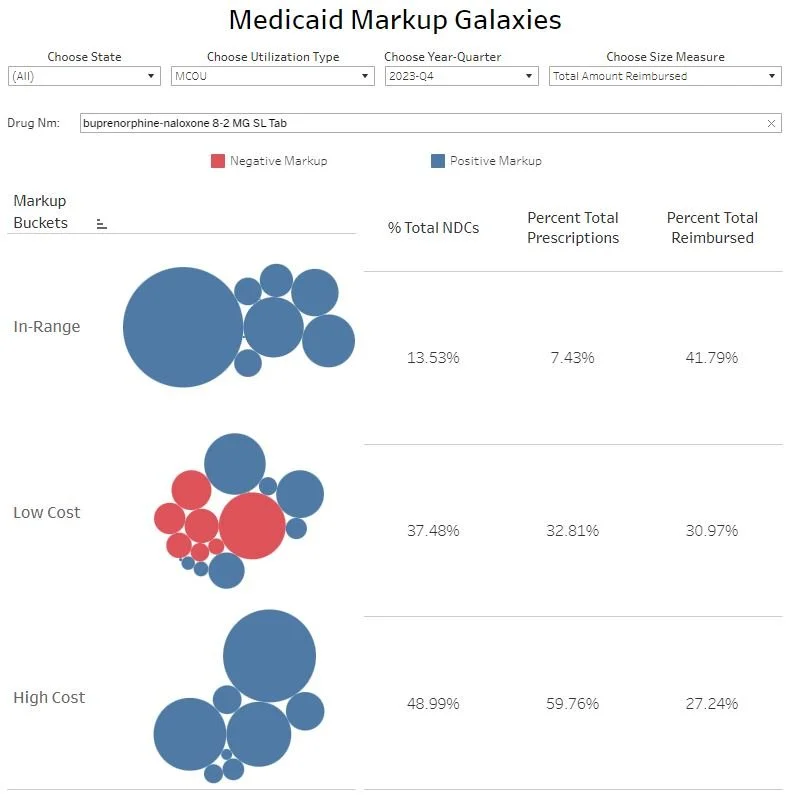
Figure 5
Source: Data.Medicaid.gov, 46brooklyn Research Medicaid Markup Galaxies

Figure 6
Source: Data.Medicaid.gov, 46brooklyn Research Medicaid Markup Galaxies
As can be seen in the figures above, our delineation of generic Suboxone costs against NADAC shows us that Medicaid managed care organizations (MCOs) across the country don’t have one approach to paying for this drug. While our “In-Range” bucket gives us insight into what we may expect a Medicaid program to reimburse (the drug’s cost plus a dispensing fee of $10 to $12 [i.e., that much payment above the NADAC]), we can see above that Medicaid MCOs seem more likely to provide a financial reward to pharmacies to dispense generic Suboxone (in the form of paying a large amount of money above its NADAC-measured acquisition cost), which occurs for 60% of the tablet or film prescriptions, versus providing a financial disincentive for dispensing generic Suboxone (which occurs for 33% of tablet or film prescriptions). Of course, though this Medicaid Markup Galaxies dashboard has existed in some way or form on 46brooklyn since 2019, few seem prepared to acknowledge that when there are many different prices for a drug, and those differences and prices can span the gamut from really high payments to really low payments for the same drug. It seems disingenuous to complain about drug prices as a function of their list price when the list price may or may not have had anything to do with the pricing differential in the first place. Certainly NADAC’s price point seems unable to explain the variety of Medicaid managed care payments.
For whatever reason, it has been our experience that Medicaid learnings have often not been as compelling to industry onlookers as Medicare learnings, so let’s see what Medicare plan prices are telling us about generic Suboxone and how they might help us better understand how drug prices ≠ what is paid for the drug under our current payment paradigm.
Medicaid vs Medicare: All around me are familiar faces
To start, let us acknowledge that while the Medicare pricing information we’ve become so enamored with is riveting, it is not the same as Medicaid State Drug Utilization Data (SDUD) – the dataset we used years ago to help uncover Ohio’s $245 million spread pricing plague. Whereas Medicaid SDUD gives us reimbursement and utilization information (how many prescriptions and how many units), in reporting average Medicare plan costs for drugs, we’re just provided with a unit price without much insight into how much or how often a drug is actually dispensed within that plan. As a result, our ability to understand Medicare prices will at times require us to make some assumptions that we do not have to make with Medicaid. Regardless, we can still see that the Medicaid learnings above that show disparate costs to the state and reimbursement to pharmacies (and therefore different levels of financial incentives) are true of Medicare prescriptions just like Medicaid prescriptions.
To start analyzing generic Suboxone within Medicare, we figured we’d begin quite simply by looking at the payment range for the products within the quarterly Medicare pricing file (the Q1 2024 file specifically). Said differently, what was the least amount of money a Medicare plan would pay on average for a buprenorphine-naloxone prescription and what was the most amount of money a plan would pay for the drug? Because unit prices in the files are reported out to the fifth decimal, we decided to present the information based upon a typical prescription by multiplying the smallest reported unit price and the highest reported unit price by the average number of units of generic Suboxone dispensed in Medicaid (why we did this will become clearer shortly, but for now at least appreciate that Figures 5 & 6 above were discussing per prescription averages, so we’re trying to be consistent). Both the minimum observed average price and the maximum observed average price are multiplied by the same factor, so the benefit we get in doing this is not to make the range appear any bigger or smaller, but to help us appreciate the range in a more practical sense (i.e., the value difference of a prescription rather than a single unit of the drug product). Because of the price ranges we’ve seen in our study of these Medicare plan pricing files thus far (see our prior reports), we also decided to identify, via a count, the number of unique prices observed within the Medicare pricing files and calculate the percent difference from minimum to maximum prices. As can be seen below in Figures 7 & 8, for both the tablets and the films, reported average plan prices for generic Suboxone are quite disparate from Medicare plan to Medicare plan.

Figure 7
Source: CMS Quarterly Prescription Drug Plan Formulary, Pharmacy Network, and Pricing Information, 46brooklyn Research

Figure 8
Source: CMS Quarterly Prescription Drug Plan Formulary, Pharmacy Network, and Pricing Information, 46brooklyn Research
*Note, that if we had not multiplied the reported price by some typical number of units per pill, we would have been talking about a little more than a penny per unit on the low-end of pricing ($0.69 for the 8-2 MG tablets divided by the stated 38.5 units is $0.0179 a tablet, a price that isn’t actually payable given that it has fractions of a penny within it).
In looking at the figures above for Q1 2024, both the generic Suboxone tablets and films have over 2,000 unique average plan prices within Medicare. And while we’ll be the first to admit that there are a lot of different drug pricing benchmarks that could demonstrate differences in prices based on who is buying a drug, when the same drug is being bought and sold at the same layer of the drug channel, one would expect mild variability at best. That said, no amount of pricing benchmarks would seem to be able to explain thousands of unique prices and hundreds of dollars in differences in generic Suboxone prescription costs over the same timeframe in the Medicare program.
Recall that we know from the Medicaid managed care programs that private insurers (which partner with state governments to run the managed care programs) tended to have a varied approach to recognizing generic Suboxone costs, but simply knowing and acknowledging that there is a range suggests a lot of varied financial incentives to stock and dispense buprenorphine-naloxone products and support opioid use disorder patients. Which can in turn present problems to a business seeking to manage or otherwise mitigate financial losses (particularly if that business spans multiple payers/states).
If one of the goals of private Medicare prescription drug plans is to provide a mechanism for competitive market forces to drive the price of medications down, then surely we should be able to assess the success of such a program design. One way we might make such an assessment would be to evaluate potential cost trends associated with buprenorphine-naloxone products over time. Looking at our Medicare Part D dashboard, which itself is a reflection of CMS’ own Part D dashboard with some tweaks (such as warehousing more years of data than their own public dashboard), we can see that total expenditures of buprenorphine-naloxone products have climbed rapidly within Medicare (reflecting both growing use and a shift away from the brand [whose prices are tracked separately within the dashboard]), while the average cost per prescription has not materially changed over time (certainly not trending in an equivalent manner to what NADAC suggests would occur). To be more specific, from 2019 to 2022, the NADAC deflated 51.9% for tablets ($2.06 in January 2019 to $0.99 in December 2022) and 44% for films ($5.73 in April 2019 [earliest 2019 NADAC price available] to $3.21 December 2022) – both as measured by the 8-2 mg strength. However, during that same timeframe, the Medicare Part D dashboard shows that buprenorphine-naloxone only deflated 8.4%.
Part of the reason for the disconnect in deflation is that the cost of these products in Medicare Part D over the last couple of years has been largely flat (or unchanging). The average cost per buprenorphine-naloxone prescription (which in the Part D dashboard, may represent products beyond Suboxone and its generics [because they don’t give very detailed information]) has approximated $165 over the last couple of years (Figure 9 below). Note that this $165 price point seems to coincidentally be the approximate mid-point between our identified min and max prices above.

Figure 9
Source: CMS Medicare Part D Spending by Drug, 46brooklyn Research Medicare Part D Drug Pricing Dashboard
While the data above provides one suggestion that a wide variety of prices for generic Suboxone has not necessarily seemed to have been associated with greater savings over time, we cannot know for certain that there was a lack of savings because of historic Medicare direct and indirect remuneration (DIR) for pharmacy claims; just that there is an appearance of a lack of savings (i.e., a directional signal). We can seek further validation of this information in comparing the minimum and maximum ranges for buprenorphine-naloxone products across the various parent organizations within Medicare. As we have discussed previously in our evaluation of these quarterly files, a single parent organization can offer many different Medicare plans and so although one might think that a single organization would have a single approach to pricing drugs (in relation to the one manufacturer price point often discussed), the files reveal big disparities within many of the parent organizations when it comes to drug prices. As can be seen below (Figures 10 & 11), when organizing pricing information for these drugs across the different parent organizations and placing the plans with the largest total Medicare enrollment at the top, we see pretty uniformly that all insurers are setting dozens or even hundreds of different prices for generic Suboxone with pretty significant ranges between the lowest reported plan price under that parent organization and the highest. Same drug, same timeframe, same list price environment, same plan parent organization … very different prices.

Figure 10
Source: CMS Quarterly Prescription Drug Plan Formulary, Pharmacy Network, and Pricing Information, 46brooklyn Research

Figure 11
Source: CMS Quarterly Prescription Drug Plan Formulary, Pharmacy Network, and Pricing Information, 46brooklyn Research
To be clear, Figures 10 & 11 do not reflect all of the potential parent organizations in Medicare – only those with the most enrollment (at least that have prices / coverage for the identified drugs).That said, it’s hard to review the above figures and not appreciate how variable Medicare prices actually are. The 46brooklyn Medicare Part D Dashboard conveys an idea that there is one prevailing price for generic Suboxone (or any drug for that matter). However, as is the case with most average drug costs, the averages conceal the range of experiences that are possible. This alone should helps us appreciate that a drug’s prevailing cost, whatever it may be, may not be a function of the manufacturer’s list price or the underlying cost pharmacies pay to acquire the drug (as a function of the range of experience being so disparate) in all instances. And if a drug’s price cannot explain all of a drug’s cost or payments, then doesn’t that signal that a drug’s price, and a drug’s price alone, is not the answer to the drug pricing questions we find ourselves asking?
We think it does.
After all, how can UnitedHealth Group have 478 different prices for generic Suboxone films? If their PBM OptumRx is negotiating to achieve the lowest cost for medicines, how does their parent organization have 477 data points that are higher than the lowest? How can CVS Health have 608 unique prices for generic Suboxone sublingual tablets where the highest price is 96 times higher than their lowest price? If we are to assume that more leverage for a plan/PBM means better negotiating power, how can Humana – a plan parent organization with nearly 18 times more enrollees than Health Care Service Corporation – be charging more than $20 more per generic Suboxone films prescription than their competitor with less enrolled lives (i.e., less leverage)? How can Elevance Health’s lowest price for generic Suboxone sublingual tablets be 137 times higher than CVS Health’s lowest price?
If these learnings are not clear from the above figure, then perhaps Figure 12 below – which compares the various min-max film prices identified above against NADAC (as of March 2024; the end of Q1 2024) – can better demonstrate where these plan prices land relative to the typical costs pharmacies pay to acquire the drug. Note that we ask these questions to not villainize any particular company, but to simply demonstrate that the only predictable thing about the pricing of prescription drugs in Medicare is that they are wildly unpredictable. In other words, buyers beware; as you may have to haggle over drug costs more than you may think if you are of the belief that a drug’s price is the sole determinant of the drug’s cost.

Figure 12
Source: CMS Quarterly Prescription Drug Plan Formulary, Pharmacy Network, and Pricing Information, CMS NADAC 2024, 46brooklyn Research
*Please note that Figure 12 has been revised from its original to fixed typos on the x-axis (plan names).
With all the variability in price identified, if we want to evaluate the pricing behavior further, we’re going to need a way to approximate the typical generic Suboxone cost for Medicare. Lacking specific information regarding utilization per plan in any of the published quarterly or monthly files (and lacking an SDUD-style repository of data for Medicare), we elected to weigh the various reported plan prices based upon the associated enrollment amounts with each plan. To do this, we relied upon a separate database from Medicare, the Medicare enrollment by plan level for all organization types. Because the prices are reported at the plan level and the enrollment is reported at the plan level, we can estimate typical generic Suboxone prices as a function of enrolled lives potentially exposed to that price point. While undoubtedly not all plans are going to have uniform distribution of all drugs, we’re hoping that some of the laws of large numbers will help make this analysis meaningful. In essence, we believe that the average generic Suboxone price in Medicare will be a function of how many people within each Medicare plan got a prescription for the product and what each of those plans paid for that prescription when the member got it. We have reported what the average price is per plan; we just don’t know how much each plan is purchasing. But it seems reasonable to assume that more utilization will occur in plans with more enrolled lives (and so the price associated with plans with higher enrollment should be given more of a role in estimating average prices than plans with smaller enrollment). Again, while it seems reasonable, we cannot know for certain and so we view these next analyses as directional of what is occurring (not definitive).
Medicare enrollment data shows us that the top six plans have over 70% of the enrollment, but as we’ve already shown with these files, we cannot simply rely upon the price within these plans, because they can have hundreds of unique prices for the same drug with vast ranges from the lowest price to the highest (see below for this information for the generic Suboxone products). By taking the plan price information and weighting it against enrollment, we hope that the end result will approximate the typical Medicare experience. Again, if a Medicare parent organization has one plan with the observable lowest price in Medicare, but no one enrolled in that plan, then does Medicare really have access to that price (particularly if that same parent organization has a plan with a bunch of enrollment in a plan that has a higher price point)? If there were one price at each of these individual parent organizations or plans, this exercise wouldn’t be necessary, but because there are hundreds of prices with many multiples between the low and the high, we are taking a chance to get a better understanding of reality by estimating price off of the enrollment data.
If our assumption is correct about typical pricing being a function of exposure to price points based upon enrollment, then we will be able to do similar things with these Medicare prices as we do for Medicaid SDUD information. This is because we could map where the plans are offered to get a sense of state-to-state variance in Medicare pricing just like we use SDUD to get a sense of state-to-state variance in Medicaid.
Nevertheless, as the remainder of this analysis will focus on an enrollment-weighted worldview of price, we feel it reasonable to caution that any interpretation of the data we offer should be considered at the very best a directional clue about what may be going on with paid amounts for generic Suboxone and not the gospel truth about these drug costs. For example, there is a chance that some beneficiaries will not purchase the drug because the price at the pharmacy counter established by the plan is simply too high. In two years, the Part D payment data will not capture these unfilled prescriptions and possibly show a lower price than our analysis suggests. We do not know what will happen, but simply are attempting to gauge an idea of how experiences may vary based on the price enrollees have access to in a given region. Hopefully, those with ResDAC level access to Prescription Drug Expenditure (PDE) data can come along and let us know how close our estimates were (or were not).
With that explanation out of the way, let’s look at what we’ve found in our enrollment-weighted approach.
The power of manyyyyy … different prices for the same drug
First, we can use our enrollment weighting to regionalize the Medicare pricing information, because the regionality of the plans is known and reported. This means we can evaluate the average price per prescription on a state-level within Medicare much like we do within Medicaid by showing the price within the state as a function of the average price per plan weighted to the enrollment within each plan in the state. As we can see below in Figures 13 & 14, the weighted average price we’ve derived shows us that the prices for these medications can range from $25.82 to $101.16 (South Carolina on the low end and Idaho on the high end) for the tablets, and $47.38 to $362.76 (Nevada on the low end and Minnesota on the high end) for the films.

Figure 13
Source: CMS Quarterly Prescription Drug Plan Formulary, Pharmacy Network, and Pricing Information, 46brooklyn Research

Figure 14
Source: CMS Quarterly Prescription Drug Plan Formulary, Pharmacy Network, and Pricing Information, 46brooklyn Research
In essence, above we created a Medicare heat map much like we already have done in the past for Medicaid. And the heat map shows us that pricing for generic Suboxone is not the same across the country – not even close. While NADAC tells us that there are little, if any, differences in the cost to acquire the medication (the transaction between pharmacy and wholesaler) across the country, the rewards for selling the same medication across the country can be very different (even if the same pharmacy or the same insurer is operating state-to-state).
In many ways, this isn’t surprising for these resident drug pricing dorks. In looking to make a comparison between Medicare and Medicaid payment state-to-state, in Figures 15 & 16 below, we show what Medicaid MCO payment for generic Suboxone looked like from state-to-state (although Medicaid data below is for Q4 2023, not 2024 like our Medicare prices above; Q4 2023 is the most recent Medicaid data we have available)

Figure 15
Source: Data.Medicaid.gov, 46brooklyn Research Medicaid Drug Pricing Heat Map

Figure 16
Source: Data.Medicaid.gov, 46brooklyn Research Medicaid Drug Pricing Heat Map
With the above we have both Medicare maps and Medicaid maps and so we can make comparisons between these two programs. Consider the state of New York, one of the most populous in the country with roughly 7 million people enrolled in Medicaid and 3 million people enrolled in Medicare. While New York Medicaid managed care may be offering pharmacies roughly $200 for 30 generic Suboxone tablets, New York Medicare plans appear to be offering just $39 dollars for those prescriptions.
Note that the New York Medicaid figure is a little surprising as we know that as of April 1, 2023 all New York Medicaid prescription drugs were carved out of Managed Care (and this data is from Q4 2023). So the above Medicaid figure represents a cost being incurred either from some grandfathering of claims, some gap in enforcement of carve out, medical billing of Suboxone (a separate issue), or some other event. Meanwhile, the New York Medicaid fee-for-service (FFS) program, where most Medicaid claims are paid for in the state, averaged payments to pharmacies of around $33 per prescription.
Regardless, the data shows that opportunity for dispensing generic Suboxone in New York is highly varied, with at least some pharmacies positioned to make a lot more than others at a range of approximately $30 to $200 for the same drug in the same state, all around a similar timeframe (i.e., a directional signal). Conversely, within Kentucky, the Medicare plans there seem to be providing a large incentive to dispense the generic films of Suboxone – offering over $84 in reimbursement above NADAC for 46 films – whereas the Medicaid MCO plans are offering just $1.84 for the same amount of films (i.e., paying just $0.04 above NADAC cost per film).
In both instances of these disparate state experiences in Medicare vs Medicaid, we would expect the pharmacy dispensing these prescriptions to have incurred the same cost to acquire the medication they’re going to sell (which NADAC informs us would be approximately $40 dollars for generic Suboxone tablet prescriptions). However, despite the pharmacy having purchased the drug at one price, one set of payers is offering a lot of financial incentive to fill that prescription to the pharmacy, whereas the other is offering very little. Said differently, the same drug acquired by the pharmacy – with one set of manufacturer list prices surrounding whichever specific labeler version they actually purchased – is being offered very different payment to sell that drug despite the underlying sameness of the medication, potentially even different incentives from the same PBM buyer. It is not hard to see how such differences could lead to access issues within certain payers for certain drugs, and might result in certain geographic areas having pharmacies open and others being pharmacy desserts. If drug pricing isn’t just a function of the manufacturer price or the price a pharmacy pays to acquire the medicine, but rather is a function of which payers are present in the area – and therefore which subjective drug payment amounts are present in the area – then perhaps some of the what is going on in the drug supply chain starts to seem more understandable than it would otherwise seem on its surface.
In our May pricing update, we questioned how the contraction of pharmacy locations as represented by Rite Aid and Walgreens closures would make sense considering the financial incentives of our convoluted drug pricing system. In that report, we questioned that if the largest retailers had insufficient leverage to achieve payment contracts that support, sustain, and grow their businesses, then is closing pharmacy locations really going to help them improve their financial performance (since it’d likely just lower the amount of drugs they purchase and therefore increase their acquisition cost through diminished purchasing power on the buy side of their business)?
However, in this analysis, perhaps we can see how changing the payer mix by being present (or not present) in geographic areas where certain patients with their specific kinds of insurance could perhaps be a winning strategy to bring back investor returns (for those investors who are buying into these businesses). Rite Aid, for example, has completely exited Michigan and most of Ohio.
Said differently, the status quo seems to be telling patients that their ability to get medications filled at a conveniently located pharmacy may not be a function of our individual insurance, but rather a function of the insurance of all of our neighbors. We may have an insurer who overly rewards a pharmacy for dispensing certain medications, but if all my neighbor’s insurance plans don’t, then pharmacies will likely leave my area regardless of my insurance or what the drug’s acquisition cost or list price was to begin with (note: pharmacies acquire drugs before selling them to patients – and therefore financial risk to the business happens before any potential sale is made).
For casual industry onlookers, this point may not always resonate, as the pharmacy marketplace and the patient cost-sharing experience can be such a tale of haves and have nots that are hidden by aggregated assessments. For every pharmacy that closes, there is another barely getting by, and another that relatively speaking, is thriving. For every patient that can easily afford their medicines, there may be another that can’t.
But the lesson here is not meant to be that some pharmacies run better businesses than others or that some patients have different economic circumstances that drive their affordability for prescription drugs. No, the lesson here is that the subjective and disparate price-setting of medicines by intermediaries in the drug channel – that often have no direct relationship to the list price or acquisition cost of those medicines – results in subjective and disparate outcomes for providers, patients, and plan sponsors. Or saying it differently, if you’re someone who questions where price discrimination is originating in the drug supply chain, it is hard to see how a pharmacy stocking one medication (i.e., one set of manufacturer prices and one pharmacy acquisition cost) is potentially getting various financial rewards for selling that medication to potentially the same buyer (i.e., a PBM who pays them different amounts for the same drug). And what’s more, these forces may change quarter-over-quarter, not because a pharmacy’s acquisition price changed all that much (i.e., they may continue to buy the same manufacturer at the same price point in future quarters), but because the price paid to them for that same drug changed (for whatever reason deemed by the intermediary).
OK … but what’s MY price?
There is one final Medicare pricing analysis we can make in regards to generic Suboxone that we cannot make with Medicaid. Medicaid is limited in the amount of cost sharing that can imposed upon its beneficiaries, and for generic drugs, we know that cost sharing is generally not going to exceed $4 within the program. We cannot say the same for Medicare. Standard Medicare plan design (which to be clear, is not how the majority of members actually experience the benefit) imposes $500+ deductibles with 25% cost sharing of drug costs in most phases of coverage for the Medicare beneficiary (up to a maximum out-of-pocket of $8,000 in 2024; $2,000 maximum coming in 2025). In essence, Medicare members are potentially more exposed to pricing irregularities then Medicaid members (to the degree they share in a percentage of the costs).
In looking at what we’ve learned about disparate generic Suboxone costs in Medicare, 25% cost sharing doesn’t seem too bad if the medication is $1, but we can see how it would be unpleasant to pay 25% of those $300 cost sharing amounts (i.e., ~$75; double the assumed pharmacy acquisition cost, per NADAC, to begin with). If you look at the average gross spending per beneficiary in 2022 for buprenorphine-naloxone products within the Part D dashboard, the value sits at approximately $1,200 per member. This of course means that many members will go through the deductible (in 2024, standard deductible is $545) and a good portion of the initial coverage phase of 2024, all else being equal (note: benefit design in Medicare can change year-over-year and will be changing significantly in 2025 from what they are today). Said a different way, how valuable we perceive $1,200 in gross spending per member can be contextualized as a function of the minimum and maximum prices we’ve thus far reviewed. At $0.69 per fill (i.e., the minimum Medicare price for generic Suboxone tablets) of the generic tablets, that is effectively 1,200 months worth of medication. At $300 per fill (i.e., the maximum price for generic Suboxone tablets), that is just four months of medication. Such a disparity in value is bonkers when viewed in this manner.
But we know that disparate pricing will make individual experiences different as both a function of the different price (think minimum to maximum), but also as a function of different benefit design choices (think flat copay vs. coinsurance). To get a sense of what this can look like, we estimated the typical cost sharing amounts Medicare enrollees will pay for the generic Suboxone medications we’ve been reviewing as a function of the tier the plan assigned to the product (each plan can assign a different tier) and the reported cost sharing for that tier for that plan (a given tier can be given a flat copay amount or a percentage-based [i.e., percentage of the total drug’s cost] cost sharing amount [with the specific amounts, either flat or percentages, differing plan-to-plan]). To be clear, while it is relatively simple to recognize either flat dollar amounts or percentages within these files (and multiply the percentage by the stated average plan cost), what we’re showing below is taking those values and presenting a weighted experience based upon enrollment and not specific utilization amounts or any other factors which may effectuate a given member’s cost sharing. For example, if a member receives a low-income subsidy (LIS) to help offset the premium and/or cost sharing amounts they’re required to pay under Medicare, we cannot know nor model how those dynamics will play out. Additionally, if a member is just starting to take the medication (and therefore subject to full payment amounts until their deductible is met), whereas another member has already met their deductible and getting the benefit of initial coverage cost sharing amounts (i.e., 25% in standard benefit design), we cannot distinguish between those events. Rather, what we’re showing in the below Figures 17 & 18 is simply taking the reported cost sharing amount (be it a flat dollar or a function of a percentage of the plan’s price) and showing what those amounts look like based upon the enrollment figures within each Medicare Part D plan.

Figure 17
Source: CMS Quarterly Prescription Drug Plan Formulary, Pharmacy Network, and Pricing Information, 46brooklyn Research

Figure 18
Source: CMS Quarterly Prescription Drug Plan Formulary, Pharmacy Network, and Pricing Information, 46brooklyn Research
This is much like we did with weighted price above (trusting that in the aggregate, it’ll be generally true based upon exposure); however, we cannot provide a visualization that will be accurate in all scenarios. To be as explicit as we can be, the caveat emptor to what we’re about to show is that all else being equal, the directional signal we’re being provided based upon the varied plan prices, cost sharing, and enrollment figures within the Medicare data suggests that cost sharing amounts for generic Suboxone are a function of where you live as much as it is a function of anything else potentially related to the drug itself. Note that in the figures above, we’re showing out-of-pocket costs based upon getting the medication at a non-preferred pharmacy, as (1) there is no requirement for plans to have a preferred pharmacy or non-preferred pharmacy network; and (2) there was generally not that much difference between what we see below and what preferred preferred pharmacy cost sharing data shows.
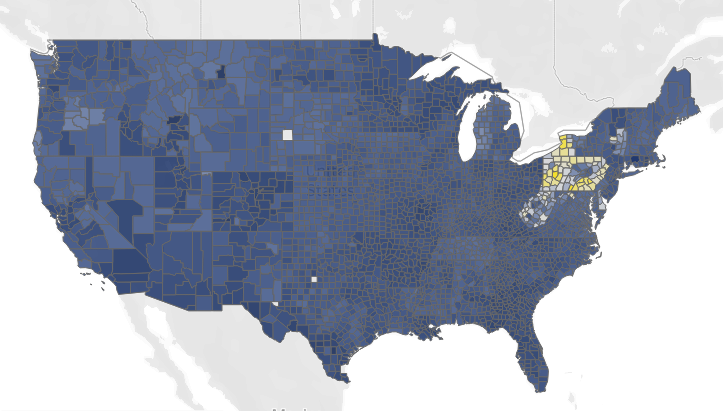
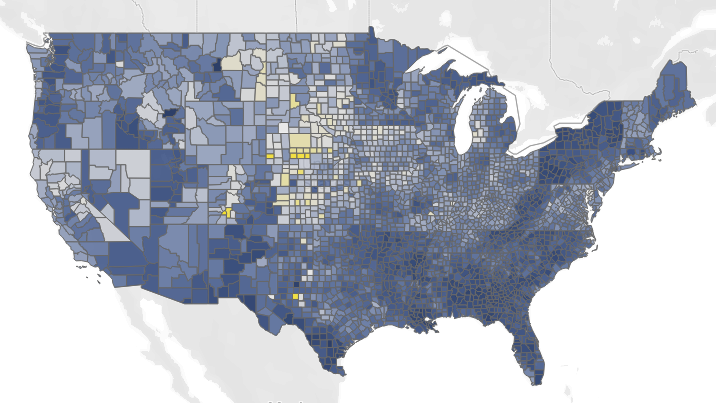
In reviewing the above figures, for the generic Suboxone tablets, the lowest cost sharing state based upon plan design relative to prices and enrollment would appear to be Rhode Island ($2 per prescription), and the most expensive would appear to be Pennsylvania ($14 per prescription). For the generic Suboxone films, the least would appear to be Louisiana ($15 per prescription) and the most expensive would appear to be South Dakota ($53 per prescription). In other words, we should recognize that the above patient cost sharing learnings (Figures 17 & 18) are not that different compared to what we saw with the weighted price analysis previously (Figures 13 & 14). When there is variability in price for the same drug, there will be some regions exposed to low prices and some regions exposed to high prices. And not just at a state level – but even at a county level, as can be seen in county-level views (in the gallery to the side) of the weighted non-preferred OOP data that we showcased in Figures 17 & 18.
With the Medicare OOP view, we see that when there is variability in plan design (as exists between Medicare plans), there will be people more or less exposed to the underlying drug cost variability (at least from the point of view of the standard benefit design). Of course, regional differences can be more or less impactful based upon the challenges in those regions. It is not lost on us that Appalachia is an area facing greater opioid use disorder issues than many other parts of the country. Whether these prices are playing a role we cannot say, but there are at least some pharmacists who seem to recognize the challenges patients face in accessing these drugs relative to the drug prices.
Putting the above into a different perspective, if a parent organization is going to have some of their plans pay $1 for generic Suboxone and other plans pay $300 (the min-max differences observed for generic Suboxone) – but both plans provide a hypothetical flat copay to the Part D beneficiary to get the drug – from the member’s perspective, they don’t see, or potentially even care, about the paid price difference at the point-of-sale. In such a scenario, the price the member likely cares about is the price they pay, and if both plans are charging the same flat copay, they’ll probably select the plan based upon other factors (like its monthly premium cost or whether one plan is offering any additional benefits like a gym membership or dental insurance).
However, just because patients can be insulated from the pricing variability of various Medicare plans does not necessarily absolve them of concerns over the underlying costs. Perhaps members are more impacted by the pricing variability being offered than we may otherwise think.
Consider the following: Which plan do you think a Medicare enrollee is likely to sign up for?
Plan A: $100 monthly premium, $0 copays;
Plan B: $25 monthly premium and 25% cost sharing;
Plan C: $50 monthly premium and 25% cost sharing.
On its surface, we think we can eliminate plan C relatively easily (higher premium, same cost sharing as a lower premium plan), which means the decision would come down to (at least at a high-level) whether you value $0 costs at the pharmacy or not. But let’s put some theoretical numbers to these plans based upon the pricing variability we’ve observed for generic Suboxone. If you buy a Medicare plan that requires you to pay a premium of $100 per month to get the plan with $0 copays, then you may be paying the same amount as a plan that charges a 25% cost share for your drug and a $25 monthly premium. The math would work out to be equivalent if the price of the drug you’re paying a 25% cost sharing on is $300 (i.e., 25% of $300 = $75; $75 drug cost plus a $25 monthly premium = $100 per month; the same as paying a $100 monthly premium and $0 copay). While this example shows no potential harm to the patient, consider an alternative drug price scenario. If an alternative plan is also offering 25% cost share with a $50 monthly premium, but the 25% cost share is not off $300, but off a $165 drug cost (i.e., the average price for buprenorphine-naloxone according to the Part D dashboard), then all of a sudden, it may be worthwhile to buy this plan (i.e., 25% of $165 = $41.25; $41.25 drug cost plus a $50 monthly premium = $91.25; almost $10 in savings relative to the previously identified $100 cost).
What this math is showing us is that when we evaluate plan design as a function of cost sharing and premium, without recognizing that cost sharing value can be a variable number if drug costs set by the plan/PBM are variable, then seniors may think that a 25% cost sharing plan with a $25 per month premium will always be the better value plan than a 25% cost sharing plan with a $50 premium, when the reality is the latter plan may actually offer more value to the member. When Medicare plan drug pricing variability is as wide as we’ve observed it in this analysis – where we see 2,000+ different price points for one drug across just over 170 different parent organizations – it is critical to understand that there is seemingly an unlimited number of ways in which the high premium, low copay plans can be more or less value relative to lower premium, high copay plans.
To be clear, Medicare plan finder seems to understand this, as plans are default sorted for seniors based upon their premium and theoretical drug costs, but that only works if seniors know what drugs they’re going to take in a given year; that is to say a senior cannot start a new therapy or change dosage forms, or move locations, or change pharmacies without risking pricing distortions, to say nothing of how prices may change over the year.
And if all of this seems like math for math’s sake, it’s important to appreciate the magnitude of complexity that we’re asking seniors to navigate. We highlighted just one aspect of the obscene Medicare Part D learning curve back in 2021 with our look at the formulary distortions involving the popular multiple sclerosis drug, Tecfidera. With the backdrop of these new generic Suboxone learnings, the reality is that we’re effectively asking seniors to make these very complicated determinations each and every year when selecting a Medicare plan during open enrollment. We don’t just give seniors standard Medicare benefits like we do with traditional Part A and B. Seniors have to evaluate and select which drug plan they want to have. Year-over-year, there are often pushes to make changes to the benefit design structure – meaning seniors may need to attempt to solve a whole new complicated equation when evaluating which plan to select. And if we’re not recognizing or reporting upon the variance in price of any given drug, how can members make informed choices about which plan and/or cost structure will work out best for them?
Putting it differently, should you be considering as part of your retirement planning whether to move certain states because the plans in those states seem to have a more aligned and rational approach to how members recognize cost sharing? Maybe you don’t even have to move, and maybe it could be as simple as being on the border between two states and simply getting your medication filled across the border in another state from where you live. As absurd as they may sound, the Medicare Part D data highlighted above would suggest that it could make a world of difference to the fixed-incomed senior’s bottom line – whether they recognize it or not. How are those factors related to the drug’s price?
The more things change, the more they stay the same
We have spent years delving into the intricacies of drug pricing, adding layer-upon-layer of context in the hopes that we might be able to rationalize or explain what we observe to be a profoundly dysfunctional system. In case it isn’t apparent, we understand how we can easily be labeled as drug pricing skeptics. We tend not to trust what we’re told about drug prices, at least not implicitly, but rather seek to test drug pricing dogma against the realities of actual drug pricing data. Thus far, our general experience has been that what we’re told about drug pricing is often far less than the whole story (and oftentimes far from what the data would say). If nothing else, our approach is one that helps us consider what oftentimes is a rather opaque view into drug prices.
Perhaps there is no better encapsulation of this belief than ending this piece where we began – by revisiting the Drug Channels visualization that introduced this report. When we attempt to add the drug prices into our earlier summary of the drug supply chain that relies upon those same prices, it becomes evident that the complexity of our payment system for generic Suboxone reveals a troubling reality: while there may be just one average acquisition cost (per NADAC) for the drug at any given moment, that price exists within an extremely heterogeneous set of other drug prices.

Figure 19
Source: Drug Channels Institute with added price benchmark graffiti from 46brooklyn Research
If there's a lesson to be drawn from the mountain of text above, it may lay in addressing seemingly simple questions. We've recently found ourselves asking, "What do we want drug pricing policy to achieve?" But today's findings cast doubt on the relevance of that question. When prices vary so drastically across different programs and plans and regions, perhaps it’s better to start by asking, “What is drug pricing actually accomplishing right now?” since it appears that in asking what drug pricing policy should achieve we may be making an assumption that a oneness to drug pricing exists that policy can address, when in fact, a uniformity to pricing doesn’t appear to exist to begin with.
Given a relatively uniform set of inputs — manufacturers produce the drug and set one group of list prices for their product (i.e., ASP, AMP, WAC); pharmacies purchase the drug and sell it to various health plans at a singular usual & customary price point (i.e., not buying a special version of the drug for Medicare and a different version of the same drug for Medicaid) — how do we end up with such disparate amounts in what is ultimately paid for a drug? Answering these questions might help us better understand what we want drug pricing policy to achieve.
If those questions seem insufficient, consider this as an alternative: "Are we certain that secrecy in drug pricing is beneficial?" Or to put it another way, "Who actually benefits from the opacity surrounding drug payment amounts, and can we rank them?" We've been led to believe that ’the wrong kind of transparency’ in drug pricing would undermine the leverage needed to secure the lowest possible price. Yet, as our observations show, even among insurance companies, the prices paid for the same drug can vary widely. If the goal is to actually recognize the lowest drug costs, why not make it easier for everyone to know who is paying what, thereby encouraging the most favorable price to prevail? And why doesn’t it seem that insurers are able to secure one low price for all of their plans? Or perhaps putting it differently, why aren’t insurers prioritizing securing one price — why is there a need for tens of thousands of PBM pricing lists?
One thing is clear: the current system, and the direction it's heading, will continue to provide us at 46brooklyn with countless opportunities to explore and expose the complexities of drug pricing through an ever-expanding array of examples and analyses — for better or worse.