Over the last nine months we have sliced and diced generic drug pricing within Medicaid managed care to arrive at the conclusion that generic prices in Medicaid are subject to wild and seemingly arbitrary distortions. But the million dollar (or should we say $2 billion dollar) question is whether this problem is isolated to Medicaid, or if it is a broader issue plaguing Medicare Part D and Commercial plans as well? We now attempt to bring data into the fold to help answer this question. In this report, we embark on an in depth investigation into the pricing of the top 15 generic drugs in Medicare Part D - drugs that represented roughly a third of overall Part D generic spending in 2017. It turns out that the same arbitrary generic pricing behavior we have observed in Medicaid is alive and well within Part D.
Read MoreWith two months of solid data so far in 2019, according to CMS data, brand drug list prices appear to be largely under control when compared to previous years. While the data does not reflect true net costs, these are noteworthy trends regardless, and signs of the erosion of the much-maligned drug pricing “gross-to-net-bubble.” Check out this update for a breakdown of the price increases, as well as an update on the peculiar case of generic Prilosec spending.
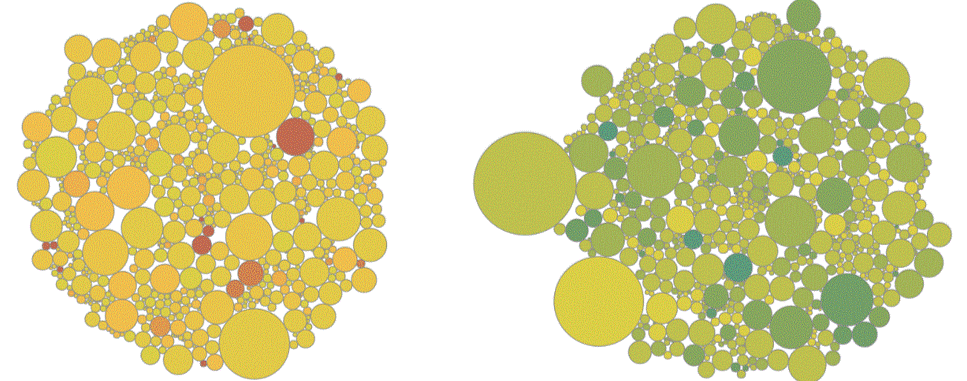
Read MoreIt’s NADAC survey results week, which means it’s time for our next installment of “what happened to generic drug prices last month.” It looks like we saw some very unfortunate generic inflation this past month. As always, the details matter, and we’re here to provide them for you. Check out our latest drug pricing report for a lot of important updates, plus an updated and upgraded NADAC Packed Bubble Chart!
Read MoreLooking to drill deeper into a state’s markup universe? Then our newest viz is for you. Medicaid Markup Galaxies separates each universe into three different groups (or celestially-speaking, “galaxies”). We call them the High-Cost, In-Range, and Low-Cost galaxies. The goal in doing so is to better quantify the nature of generic pricing distortions within state Medicaid programs. Additionally in today’s update, we put a bow on January’s brand drug price increases. See how 2019 is shaping up.
Read MoreIt’s NADAC survey results week, which means it’s time for our next installment of “what happened to generic drug prices last month.” On a positive note, it looks like there was a substantial amount of generic deflation in the aggregate. As always, the details matter, and we’re here to provide them for you. Check out our latest drug pricing report for a lot of important updates, plus an updated and upgraded NADAC Packed Bubble Chart!
Read MoreThe start of each new year brings a lot of “new-ness,” including a new round of price increases on brand-name drugs. This year has been no exception, and the media has been all over the subject. Unfortunately, we’ve found it difficult to figure out the “so what?” behind all of these price increases. On one hand, we are being told that the pharmaceutical manufacturers are back to “business as usual,” while on the other we are being told that the number of price increases are down meaningfully from last year. Which one is it? This felt like an opportunity to inject a healthy dose of facts into this discussion. So we set out to build a dashboard, 46brooklyn’s Brand Drug Price Change Box Score, that lets you visualize all brand-name manufacturer list price changes that are publicly-reported each week, drill down to the manufacturer and drug level, strength level, and compare and contrast different periods.
Read MoreIf you’re trying to discover reasons for why drug prices go up or down, one of the best things to look at is supply and demand. A new federal antitrust lawsuit alleges that several generic drugmakers were colluding in an effort to protect market share and raise prices. To get a better sense of what was happening in the market at the time the alleged collusion took place, it helps to track a drug’s market share over time. Using Medicaid utilization data and other public datasets, we have now launched a new dashboard to provide a crumb trail for those looking to determine the market distribution of drug manufacturers as prices fluctuate.
Read MoreIt’s NADAC survey results week, which means it’s time for our fifth installment of “what happened to generic drug prices last month.” On a positive note, it looks like there was a bit of net deflation. But overall it was a less than stellar month for generic deflation - it was the first month (since we started this monthly review) where we saw more generic drug price increases then decreases. As always, the details matter, and we’re here to provide them for you. Check out our latest drug pricing report for a lot of important updates, plus an updated NADAC Packed Bubble Chart!
Read MoreAs drug pricing scrutiny grows, PBM spread pricing of cheap, generic drugs is becoming a hot topic of conversation in states across the country. After the state of Ohio opened the books thanks to an audit from the state auditor, the uncovered $224 million PBM spread now has other states scrambling to see what they are being charged as well. One of those states is Pennsylvania, where their state auditor is trying hard to get the data he needs to see where the money is going in the third largest managed care program in the country. Since there are many folks wondering what’s going on in Pennsylvania, considering the current lack of hard data, we decided to dig into the publicly available data to see if Pennsylvania appears to have the makings of an “Ohio problem.”
Read More


